Do you want to know which numbers really matter for your Amazon store? Tracking the right Amazon KPIs helps you measure performance, improve customer satisfaction, and prevent account problems. In this guide, Megaficus explains the key metrics, how to monitor them, and practical tips to keep your store performing at its best.
Quick summary: 18 essential Amazon KPIs you need to know:
- Sales Revenue
- Sales Velocity
- Average Order Value (AOV)
- Conversion Rate
- Buy Box Percentage (Buy Box Ownership)
- Click-Through Rate (CTR)
- Return on Ad Spend (ROAS)
- Cost Per Acquisition (CPA)
- Total Advertising Cost of Sales (TACoS)
- Order Defect Rate (ODR)
- Customer Ratings & Reviews
- Product Return Rate
- Customer Retention Rate
- Inventory Performance Index (IPI)
- Perfect Order Percentage (POP)
- Late Shipment Rate (LSR)
- Account Health Rating (AHR)
- Fulfillment Performance
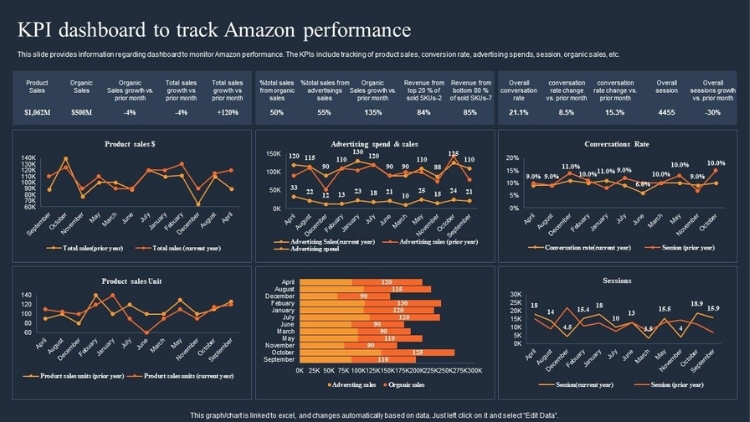
What Are KPIs On Amazon And Why Are They Important?
Amazon Key Performance Indicators (Amazon KPIs) are measurable metrics that show how well a store performs compared to its goals. They reflect different areas such as sales results, customer experience, advertising impact, and delivery performance.
Tracking these KPIs is essential for understanding your store’s overall health and guiding smarter business decisions:
- Measure progress toward goals: KPIs show whether your store is meeting sales targets, conversion benchmarks, or advertising ROI expectations.
- Identify areas for improvement: Monitoring performance data highlights weak points in product listings, pricing, or customer experience.
- Optimize marketing and operations: Understanding key numbers allows sellers to fine-tune ad spend, inventory levels, and fulfillment methods.
- Enhance customer satisfaction: By tracking feedback, review ratings, and return rates, sellers can maintain quality and build trust.
- Support long-term growth: Continuous KPI tracking ensures data-driven decision-making, helping sustain profitability and competitiveness in the Amazon marketplace.
18 Essential Amazon KPIs To Track
To manage your store effectively, it’s important to know which metrics really matter. Megaficus highlights 18 key Amazon KPIs every seller should monitor.
Sales Revenue
Sales Revenue refers to the total money a store earns from product sales during a chosen period. It is calculated as Total Units Sold × Average Selling Price. When revenue grows 10–20% month over month, it usually reflects stable performance for small to mid-sized stores.
For example, if you sell 500 units at an average price of $20, total sales revenue equals 500 × 20 = $10,000. However, if revenue falls for two or more consecutive weeks, this may indicate reduced traffic, higher competition, or stock shortages.
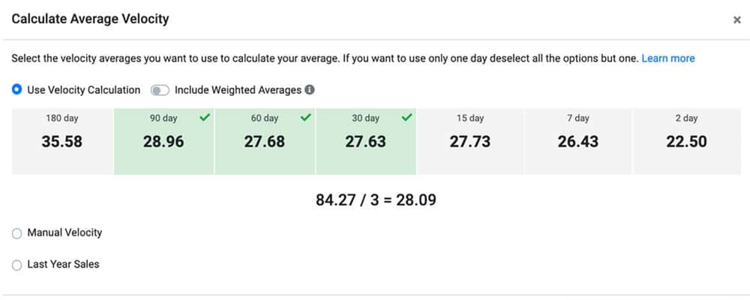
Sales Velocity
Sales Velocity indicates how quickly products sell within a specific time frame. It follows the formula: Number of Orders × Average Order Value × Conversion Rate. When sales velocity rises by 5–10% weekly, it often means consistent demand and strong listing visibility.
Imagine you record 200 orders with an average order value of $30 and a 10% conversion rate, the sales velocity is 200 × 30 × 0.10 = $600. If the number declines, this can suggest weak ad performance, limited traffic, or pricing gaps.
Average Order Value (AOV)
Average Order Value (AOV) represents the average amount customers spend each time they place an order. It is calculated using (Total Revenue ÷ Total Orders). Since AOV reflects purchasing behavior, many sellers aim to raise it by 5–15% per quarter through bundling or discounts.
As an illustration, if total monthly revenue hits $15,000 from 500 orders, the AOV equals $30. When this figure drops, it can signal that customers are buying fewer items or lower-priced products.
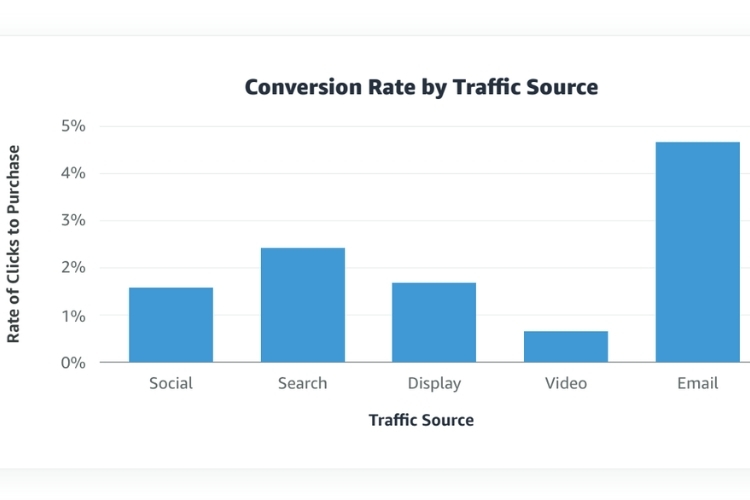
Conversion Rate
Conversion Rate reflects the percentage of visitors who complete a purchase after viewing a product listing. The formula is (Total Orders ÷ Total Listing Visits) × 100. A solid conversion rate ranges between 10–15%, while top listings can reach 20% or more.
To put it into perspective, a wireless headphone listing with 1,000 visits and 150 orders would have a conversion rate of 15%. A decline in this figure usually suggests a need to refine product visuals or pricing.
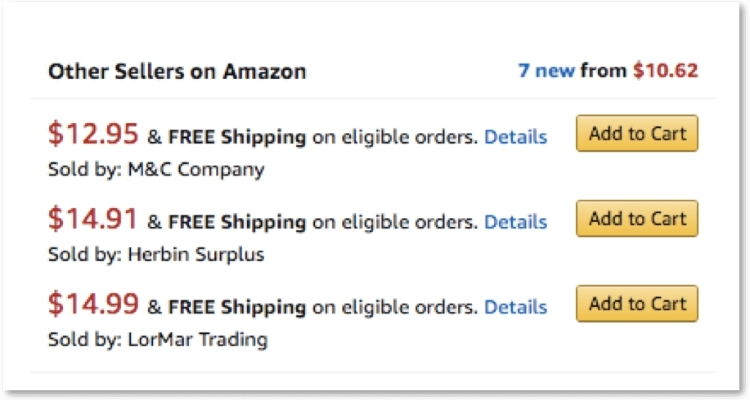
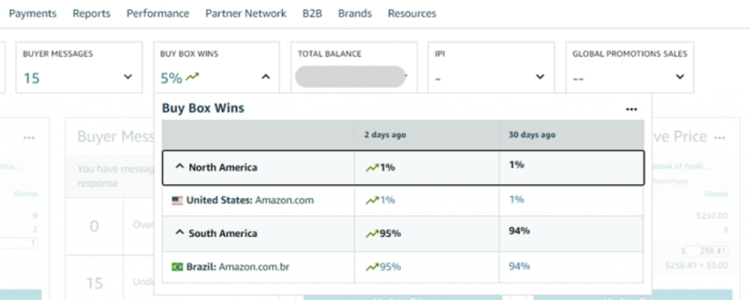
Buy Box Percentage (Buy Box Ownership)
Buy Box Percentage (Buy Box Ownership) measures how often a product wins the Buy Box on Amazon. It is calculated as (Buy Box Wins ÷ Total Page Views) × 100. A rate above 90% shows strong performance, while a drop below 80% may indicate pricing or fulfillment issues.
In real terms, if a wireless mouse listing receives 1,000 views and wins the Buy Box 920 times, the Buy Box percentage is (920 ÷ 1,000) × 100 = 92%. However, if the percentage drops to 70%, it may suggest issues like higher pricing, slower fulfillment, or poor feedback scores.
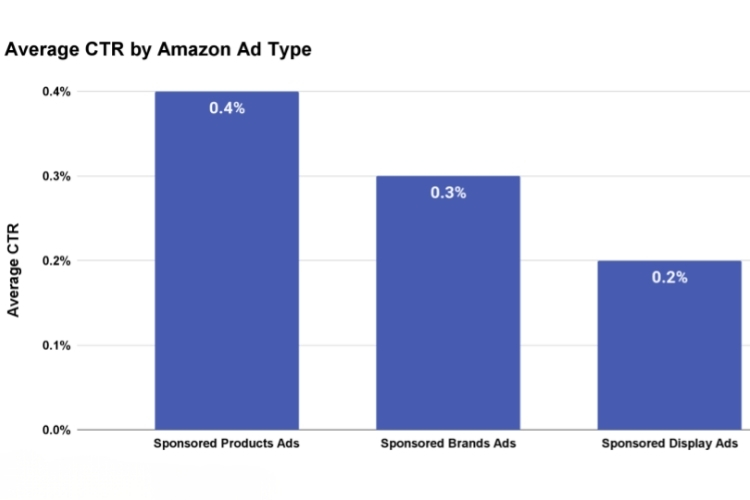
Click-Through Rate (CTR)
Click-Through Rate (CTR) monitors the ability of your ads to draw potential buyers on Amazon. It represents the percentage of users who click on your ad after viewing it, highlighting the strength of your creative assets and keyword targeting. The formula is CTR = (Clicks ÷ Impressions) × 100.
For instance, when a sponsored ad for wireless earbuds reaches 100,000 impressions and receives 1,000 clicks, the CTR equals (1,000 ÷ 100,000) × 100 = 1%. This result shows that 1% of shoppers clicked on your ad, which is a moderate engagement rate.
When CTR increases, it usually means the ad is relevant, visually appealing, and matches shopper intent. However, if CTR remains low, it may signal problems such as weak product titles, poor image quality, or inaccurate targeting.
Return on Ad Spend (ROAS)
Return on Ad Spend (ROAS) gauges the efficiency of your advertising spend in generating revenue on Amazon. It quantifies the amount earned for every dollar spent on ads, helping sellers gauge campaign profitability. The formula is ROAS = (Total Revenue from Ads ÷ Total Ad Spend).
Take a sponsored campaign promoting smart home devices as an example. When this campaign generates $5,000 in attributed sales from a $1,000 ad spend, the ROAS equals 5.0, meaning you earn $5 for every dollar invested. Generally, a ROAS above 4.0 indicates strong ad performance, while lower figures may signal overspending or poor keyword targeting.
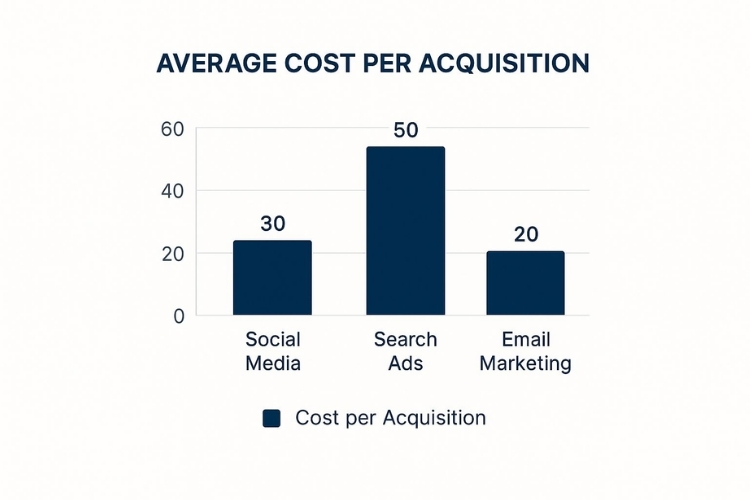
Cost Per Acquisition (CPA)
Cost Per Acquisition (CPA) shows how much a seller spends on average to gain one paying customer through ads. It reflects the efficiency of your ad spend and helps evaluate campaign profitability. To calculate this metric, divide the total advertising cost by the number of conversions: CPA = Total Ad Spend ÷ Number of Conversions.
When you spend $1,200 on ads for a skincare brand and gain 60 purchases, the CPA comes out to $20 per order. This means each sale costs $20 in advertising, which is efficient as long as your profit margins stay healthy. However, if the CPA starts to rise, it may indicate issues like poor keyword targeting, low-quality traffic, or growing competition.
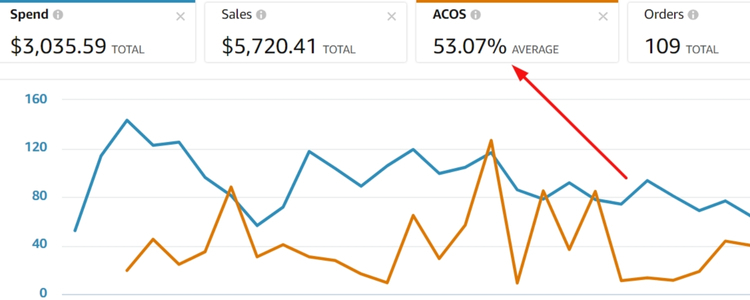
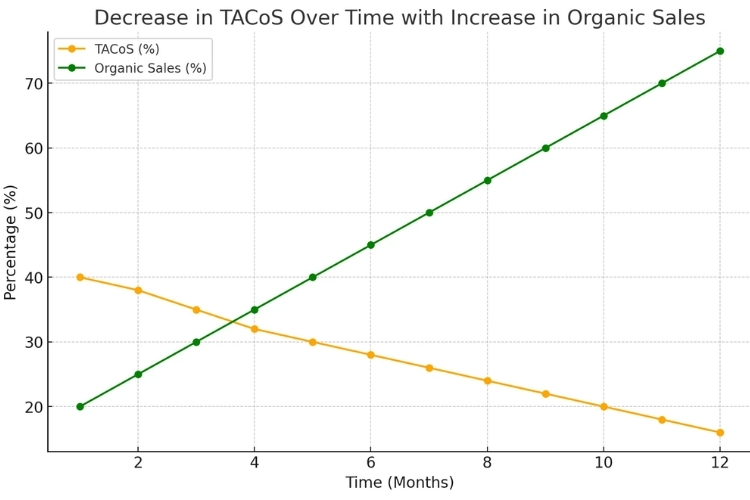
Total Advertising Cost of Sales (TACoS)
Total Advertising Cost of Sales (TACoS) reflects how advertising spend relates to your total revenue, not just ad-attributed sales. It gives a broader view of how ads contribute to overall business growth. To calculate it, divide total ad spend by total revenue and multiply by 100: TACoS = (Total Ad Spend ÷ Total Revenue) × 100.
When a home décor brand spends $1,000 on Amazon ads and earns $10,000 in total sales, the TACoS comes out to 10%. This figure reflects that ads are driving meaningful revenue while maintaining balance with organic growth. However, if the TACoS begins to rise over time, it may indicate that paid ads are taking on too much weight or that organic performance is starting to decline.
>>> Read more: Amazon TACoS: Understanding And Optimizing Your Ad Strategy
Order Defect Rate (ODR)
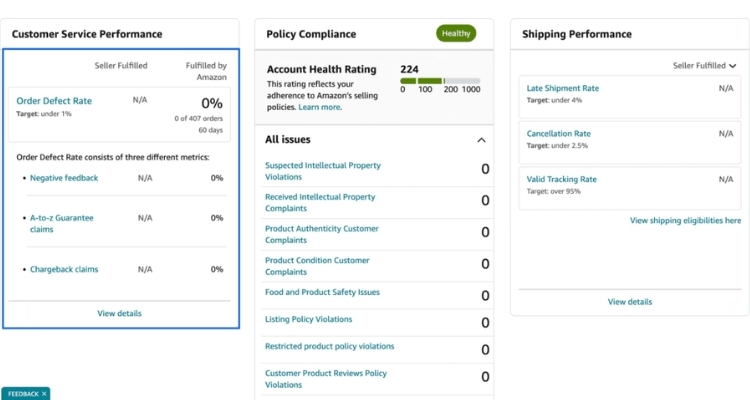
Order Defect Rate (ODR) captures the percentage of orders that received negative feedback, an A-to-Z Guarantee claim, or a service chargeback. It helps Amazon assess a seller’s overall customer satisfaction and reliability.
To find this metric, divide the number of defective orders by the total number of orders, then multiply by 100: ODR = (Defective Orders ÷ Total Orders) × 100.
For instance, if you receive 3 defective orders out of 300 total, your ODR would be 1%. This rate meets Amazon’s performance standard, as sellers are required to keep ODR below 1% to stay in good standing.
However, when the rate rises above that level, it can result in penalties such as account suspension or loss of Buy Box eligibility. Therefore, monitoring feedback regularly and resolving customer issues quickly helps maintain a healthy ODR and build long-term trust.
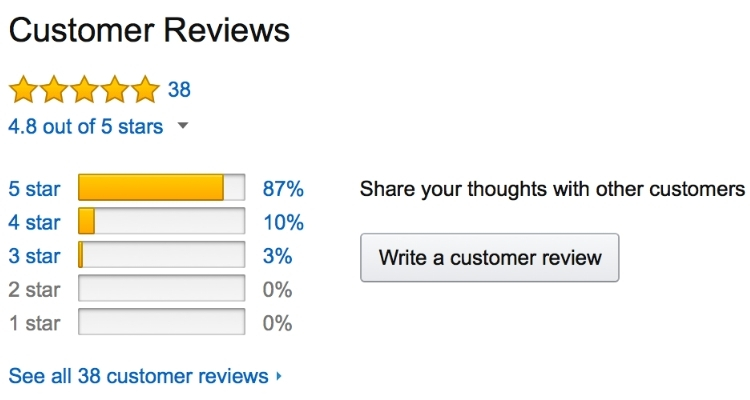
Customer Ratings & Reviews
Customer Ratings & Reviews provide insight into customers’ perception of a product’s quality and service experience. This KPI helps sellers understand customer satisfaction and brand reputation on Amazon. The average rating is calculated by dividing the total sum of star ratings by the number of reviews: Average Rating = Total Star Points ÷ Number of Reviews.
Take the case of Fitbit Charge 6 fitness trackers: 100 reviews gave a total of 450 star points, so the average rating is 4.5 stars. Since maintaining 4.3 stars or higher shows strong performance, a sudden drop often indicates issues with quality, packaging, or fulfillment that need attention.
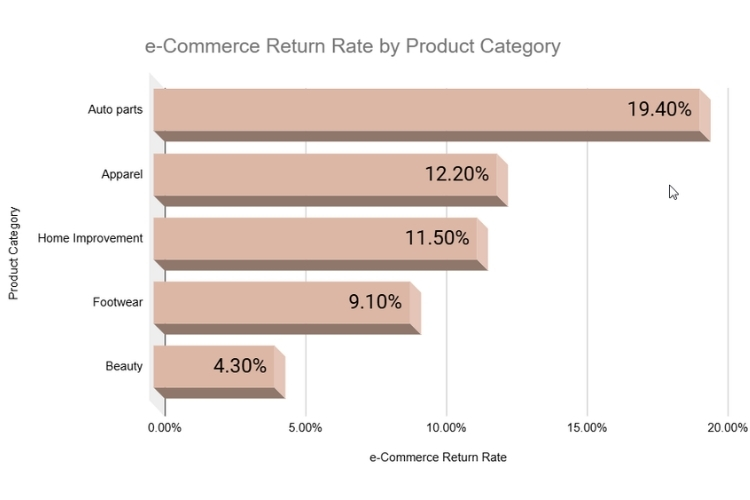
Product Return Rate
Product Return Rate indicates the frequency at which customers return purchased items within a given period. It helps sellers assess product quality, listing accuracy, and customer satisfaction. To calculate this KPI, divide the number of returned orders by the total number of orders, then multiply by 100: Product Return Rate = (Returned Orders ÷ Total Orders) × 100.
For instance, if 30 out of 1,000 orders are returned, the return rate would be 3%. This level is generally acceptable for most categories, but higher rates, especially above 5–8% (may indicate product issues, misleading descriptions, or poor packaging).
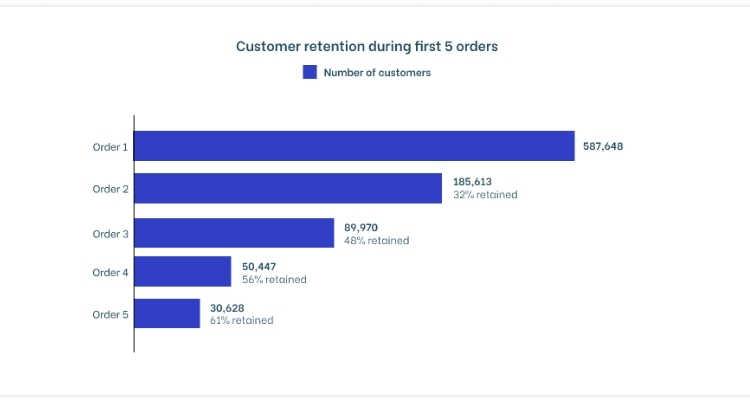
Customer Retention Rate
Customer Retention Rate measures the percentage of shoppers who continue buying from your store over time. Instead of focusing only on one-time purchases, this metric reveals customer loyalty and long-term satisfaction.
You can find it by dividing the number of returning customers by the total number of customers and multiplying by 100: Customer Retention Rate = (Returning Customers ÷ Total Customers) × 100.
To illustrate a small online bookstore: if 200 out of 1,000 customers make another purchase, then the retention rate is 20%. Since a rate in this range suggests customers trust your brand and are likely to return, a drop may indicate declining satisfaction or weak post-sale engagement.
In that case, improving after-sales support, delivery reliability, and product value can help rebuild loyalty and gradually raise the retention rate.
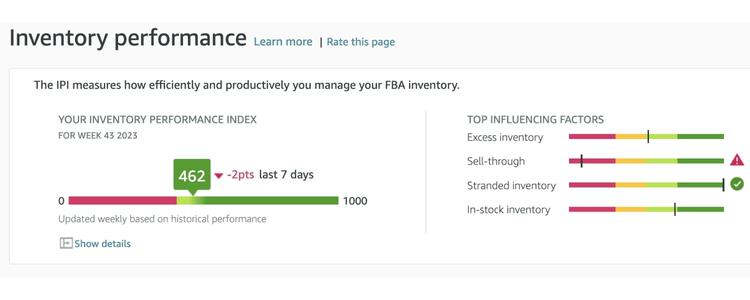
Inventory Performance Index (IPI)
Inventory Performance Index (IPI) evaluates how efficiently a seller manages inventory levels in Amazon’s fulfillment centers. It combines factors such as excess stock, sell-through rate, stranded inventory, and in-stock consistency to create a single performance score.
Looking at the Canon EOS R6 cameras on Amazon: an IPI score above 400 generally indicates healthy inventory management, meaning the headphones are selling steadily and storage space is well utilized. However, if the score drops below this threshold, it often signals problems such as overstocking or slow-moving items.
>>> Read more: Improving Amazon IPI Scores for Stable Inventory Performance
Perfect Order Percentage (POP)
Perfect Order Percentage (POP) highlights the percentage of orders fulfilled without delays, cancellations, or defects. It provides a clear picture of overall operational accuracy and customer satisfaction.
To calculate this KPI, you divide the number of perfect orders by the total number of orders, then multiply by 100: POP = (Perfect Orders ÷ Total Orders) × 100.
For instance, if 970 out of 1,000 orders are fulfilled smoothly, your POP would be 97%. At this level, it reflects strong fulfillment performance and reliable operations. However, when the percentage begins to decline, it may signal problems with shipping accuracy, packaging quality, or inventory availability.
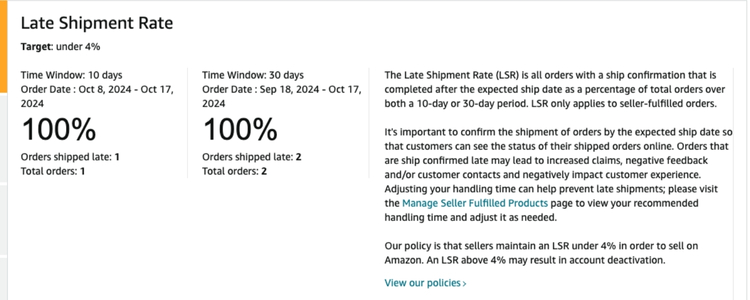
Late Shipment Rate (LSR)
Late Shipment Rate (LSR) measures the percentage of orders that a seller ships after the promised ship date. It shows how reliably a seller processes and delivers orders on time. LSR is calculated using the formula: (Number of Late Shipments ÷ Total Orders Shipped) × 100
For example, if 1,000 orders of Sony WH-1000XM5 headphones are shipped in a month and 30 are late, the LSR would be 3%, which is within Amazon’s 4% expectation. When the rate stays in this range, it reflects stable operations, but exceeding it can lead to warnings or account restrictions.
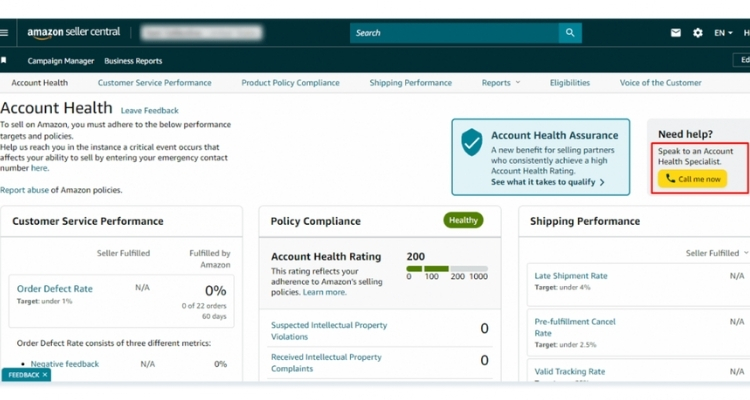
Account Health Rating (AHR)
Account Health Rating (AHR) evaluates the overall performance of a seller account based on key metrics, including order defects, policy compliance, and customer service issues, which helps determine how well a seller maintains Amazon’s standards.
Here’s a case involving LEGO Star Wars sets sold on Amazon: AHR is categorized as “Healthy”, “Warning”, or “Critical”. Keeping a “Healthy” rating secures selling privileges, while a drop to “Warning” or “Critical” can prompt alerts or extra monitoring.
Fulfillment Performance
Fulfillment Performance demonstrates sellers’ ability to process and deliver orders accurately and on time. It combines several key metrics, including late shipment rate, pre-fulfillment cancellation rate, and order defect rate. Together, these factors show how well a seller meets Amazon’s delivery standards and customer expectations.
In the case of Apple AirPods Pro 2 sold on Amazon, sellers are expected to keep their LSR under 4% and pre-fulfillment cancellations below 2.5%. Staying within these limits reflects reliable operations, while exceeding them can trigger warnings or account restrictions.
Frequently Asked Questions About Amazon KPIs
The most common KPIs include Late Shipment Rate (LSR), Order Defect Rate (ODR), Perfect Order Percentage (POP), and Account Health Rating (AHR).
Sellers should check their KPIs at least weekly to catch issues early and maintain performance.
Identify the root cause, improve order processing or customer service, and follow Amazon’s guidelines to address issues.
Amazon Seller Central provides built-in dashboards, and third-party tools like Helium 10 or Jungle Scout can help monitor and analyze KPIs.
Get Professional Help from Megaficus
Tracking Amazon KPIs is essential for any seller who wants to maintain strong performance, satisfy customers, and grow their business on the platform. By monitoring metrics like LSR, ODR, POP, and AHR, you can identify issues early, improve operations, and stay competitive.
For sellers aiming to boost their Amazon success, understanding and acting on these KPIs is key. Contact Megaficus today for expert support on analyzing your metrics, optimizing your listings, and maximizing your sales potential.