On Amazon, even a top-performing listing can still receive a steady stream of weekly returns triggered by issues like “not as described” or “wrong item”, despite the product itself having no actual defects. When these returns accumulate, they gradually reduce profit through lost revenue, shipping fees, and fulfillment costs. This article by Megaficus explores how Amazon’s return rate becomes a hidden drain on FBA profitability.
Quick Summary
- Return rate on Amazon directly reduces FBA profitability through hidden costs like returns, shipping fees, and fulfillment losses, even for best-selling listings.
- Return rate by category: Return rates vary significantly by category, with apparel and footwear at the highest levels while grocery and books remain relatively low, providing clear performance benchmarks for sellers.
- Cost of high return rate: A high return rate leads to multiple hidden costs, including lost revenue, increased FBA fees, lower Buy Box win rate, and accumulation of unsellable inventory.
- How to check return rate: Sellers can track return rate in Seller Central by analyzing return reports, focusing on return reasons, high-return ASINs, and customer feedback trends.
- How to reduce return rate: Reducing return rate requires optimizing listings, improving visuals, strengthening packaging, enhancing customer support, and acting on review feedback to close expectation gaps.
Why Amazon Customers Return Products and Why Your Return Rate Is High?
For sellers on Amazon, returns often occur when the actual product experience does not match customer expectations, and this gap usually begins at the listing or pre-purchase stage. According to Invesp, expectation mismatch, product condition, and fit remain the primary reasons behind most return decisions.
- Expectation mismatch: When product images or descriptions do not accurately reflect the real item, customers feel misled after receiving it and are more likely to initiate a return
- Wrong size or fit: When sizing information is unclear or inconsistent, customers may choose the wrong option, especially in categories like apparel or footwear
- Product quality issues: When the product has defects or does not meet durability expectations, customer trust declines, and return requests increase
- Shipping damage or delays: When packaging is not strong enough, or delivery takes longer than expected, the overall experience is negatively affected and leads to returns
At the same time, while average e-commerce return rates typically range from 5% to 15% and can reach up to 40% in categories like electronics or apparel, a higher-than-average return rate often reflects underlying operational issues that sellers need to review and improve across their listing, product, and fulfillment processes, including:
- Inaccurate listings: When product content creates expectations that the actual item cannot meet, customers are more likely to feel dissatisfied and request a return
- Inconsistent quality control: When product quality varies between batches, it increases the risk of defects and negative customer experiences
- Packaging problems: When products are not properly protected, they can be damaged during fulfillment and trigger immediate returns
- Sizing or compatibility confusion: When product specifications are unclear, customers may misunderstand how the product fits or works
- Weak customer support: When customer issues are not resolved quickly, returns become the easiest option for dissatisfied buyers
Amazon Return Rate Policy
Amazon’s return policy allows customers to return most items within 30 days, although the exact timeframe can vary by category. In some cases, categories like clothing and electronics offer more flexible return windows to improve the shopping experience and reduce purchase hesitation.
The return process also differs based on the fulfillment method, which affects how much control and responsibility a seller has:
- FBA (Fulfillment by Amazon): Amazon manages returns, including customer communication, refunds, and product inspection, which helps reduce operational workload
- FBM (Fulfillment by Merchant): Sellers handle the entire return process themselves, from receiving items to issuing refunds and resolving customer concerns
At the same time, Amazon prioritizes customer satisfaction, so return activity is closely tied to seller performance metrics and overall account health, including:
- Order Defect Rate (ODR): Return-related complaints can increase this metric and signal a poor customer experience
- Customer Satisfaction Score: Frequent returns often indicate unmet expectations and lower satisfaction levels
- Return Dissatisfaction Rate (RDR): Ineffective return handling can lead to negative feedback and additional performance risks
Amazon Return Rates by Category
Return rates on Amazon vary significantly by category because each product type comes with different expectations, usage conditions, and risk factors. Understanding these benchmarks helps sellers evaluate performance more accurately and identify areas that need improvement.
| Category | Average Return Rate | Common Reasons for Returns |
|---|---|---|
| Apparel & Footwear | 30-40% | Fit issues, size confusion, changes in style preference |
| Electronics | 10-20% | Product defects, complex setup, unmet performance expectations |
| Home & Kitchen | 5-15% | Size mismatch, color differences, assembly difficulties |
| Health & Beauty | 5-10% | Skin reactions, scent preferences, and incorrect items shipped |
| Books & Media | <5% | Wrong version, duplicate orders, gift-related returns |
| Toys & Games | 5-10% | Damaged packaging, returns after gifting |
| Sports & Outdoors | 5-10% | Sizing issues, product damage, and not matching the description |
| Automotive | 10-15% | Compatibility problems, incorrect product selection |
| Grocery & Gourmet | <2% | Mostly non-returnable, except for damaged or incorrect items |
The Real Cost of a High Amazon Return Rate
A high return rate on Amazon not only reduces revenue but also creates a chain of hidden costs that directly impact your profitability and long-term performance. Each return triggers additional expenses and weakens your ability to compete effectively on the platform.
- Lost revenue: When a return occurs, you not only lose the sale but also incur shipping and handling costs that are rarely recovered
- Lower Buy Box competitiveness: When return rates increase, Amazon may reduce your chances of winning the Buy Box, which leads to lower visibility and fewer sales
- FBA-related costs: When using Fulfillment by Amazon, returns can generate extra fees such as restocking, disposal, or losses from unsellable inventory
- Unrecoverable inventory loss: When returned items cannot be resold, they turn into dead stock that directly reduces your margins
- FBA operational errors: When fulfillment mistakes happen, such as lost or mishandled items, they often go unnoticed and create hidden financial losses over time

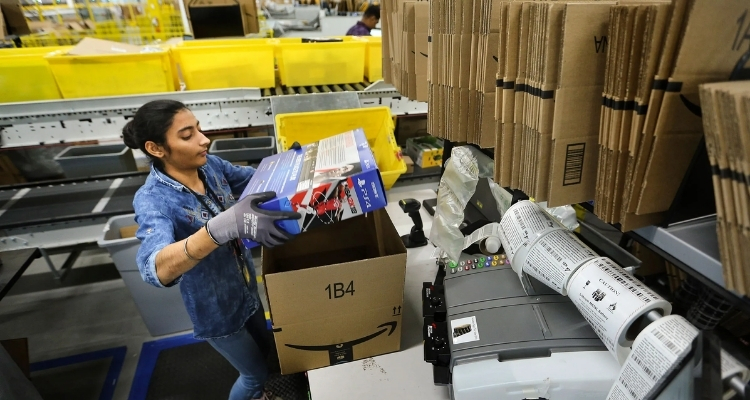
What Actually Happens to Returned Amazon Products?
When a product is returned on Amazon, the platform does not automatically put it back into your sellable inventory, because each item is evaluated based on its condition and then routed to a suitable handling method:
- Resale programs: If the product is still in good condition, Amazon inspects and tests it before reselling through Amazon Warehouse Deals with clear condition labels, or through Amazon Renewed for refurbished items that meet quality standards
- Donation programs: If the item cannot be resold but is still usable, Amazon may send it to partners like Good360 to support communities while reducing waste
- Liquidation channels: If the product is not suitable for resale on Amazon, it is often sold in bulk to liquidation companies, which redistribute it through discount retailers or secondary markets
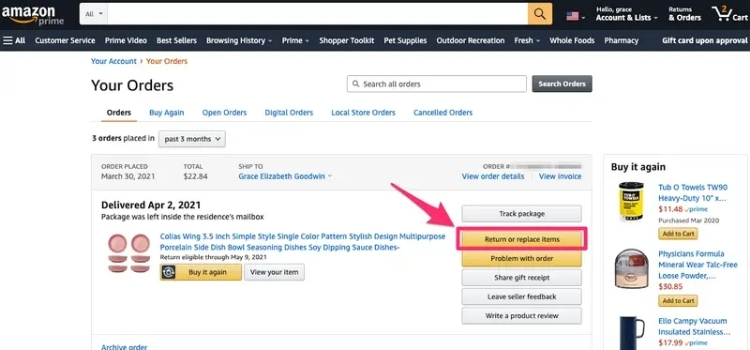
How to Check Your Amazon Return Rate?
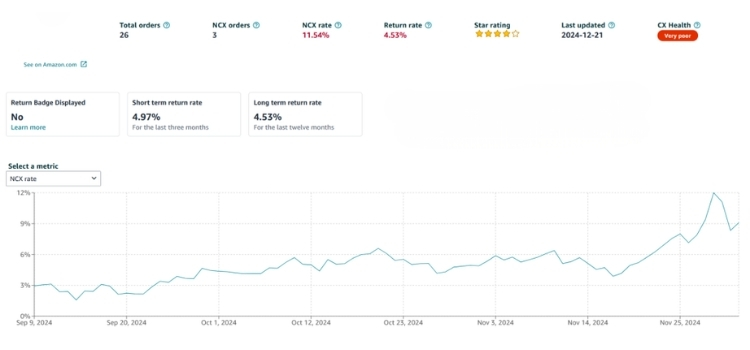
To monitor your return rate on Amazon effectively, you need to regularly access return reports in Seller Central and understand what the data is telling you, because raw numbers alone will not reveal the root causes behind returns.
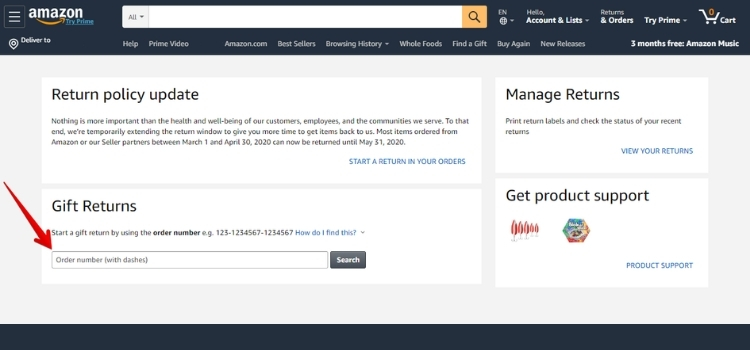
To check your return rate in Amazon Seller Central, you can follow the steps below to access detailed return reports and identify key performance data:
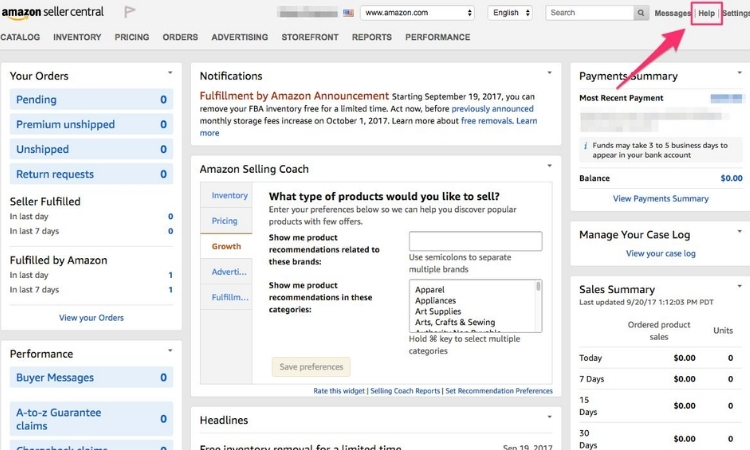
- Log in to Seller Central: Access your account dashboard to begin tracking performance data
- Go to Reports: Navigate to the “Reports” tab in the top menu to find operational insights
- Select Fulfillment: Choose “Fulfillment” from the dropdown to access FBA-related data
- Open the Returns report: Click “Customer Concessions” and then select “Returns” from the left-hand menu
- Set date range: Choose the time period you want to analyze and generate the report
- Download and review: Export the report to examine return reasons, ASINs, and order details
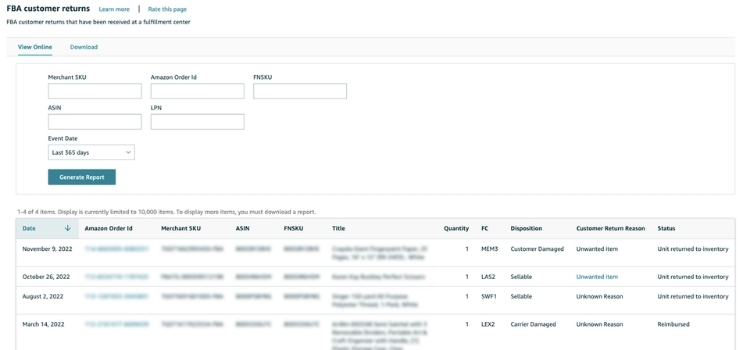
Once you access the report, you need to focus on key data points to identify patterns and take action effectively, including:
- Return reason: This shows why customers send products back, which helps you detect listing gaps or product issues
- ASIN frequency: Products with high return counts may require listing optimization or quality improvements
- Time to return: Returns that happen shortly after delivery often indicate an expectation mismatch
- Customer comments: Feedback provides deeper insight into product flaws, confusion, or unmet needs
5 Ways to Lower Your Amazon Return Rate
To reduce returns on Amazon effectively, you need to fix the gap between what customers expect and what they actually receive, which means optimizing both your listing and post-purchase experience with clear, measurable actions.
Optimize Your Product Listings
Your listing is the first place where expectations are formed, so any missing or unclear Your listing is the main driver of expectation, so even small gaps in content can lead to high return rates. To control this, you should focus on:
- Title structure (150-200 characters): Include size, material, compatibility, and primary use case to prevent wrong purchases
- Bullet points (3-5 key points): Answer the top return reasons directly, such as sizing, limitations, and who the product is not for
- Description clarity: Add FAQs and edge cases to filter out unsuitable buyers before they purchase
- Data-driven updates: Check return reasons weekly and rewrite content based on the top 2-3 causes
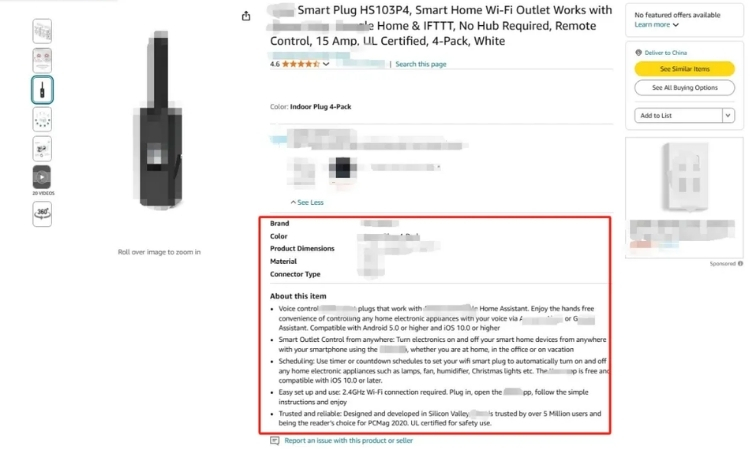
Add Visual Content
Customers rely heavily on visuals, so poor or incomplete images often lead to “not as expected” returns. To reduce this, you should:
- Use 5-7 images minimum: Include front, back, close-up, and scale comparison
- Add real-life context: Show product size in hand, on body, or in an actual usage environment
- Use infographics: Highlight dimensions, materials, and key limitations directly on images
- Add a short video (15-30s): Demonstrate usage clearly to reduce confusion before purchase

Improve Your Packaging
Packaging is a direct factor in return rate because even a good product will be returned if it arrives damaged or feels low quality. You should use durable, well-fitted packaging that can withstand shipping impact, especially for fragile items, and include a simple instruction insert or QR code to reduce misuse-related returns. If “damaged on arrival” exceeds 5% in your return report, this is a clear signal that your packaging needs immediate improvement.
For example, if you sell glass kitchenware and notice that 8% of returns are marked as “arrived damaged”, switching from single-layer boxes to double-box packaging with foam inserts can significantly reduce breakage during shipping, which directly lowers return rates and negative reviews within the next 30-60 days.

Prioritize Customer Service
Customer support can prevent returns when issues are resolved before customers decide to send products back, so response speed and problem-solving ability directly impact your return rate. You should respond within 12-24 hours, offer troubleshooting solutions before approving returns, and proactively reach out when negative feedback appears, because resolving the issue early is often cheaper than processing a return.
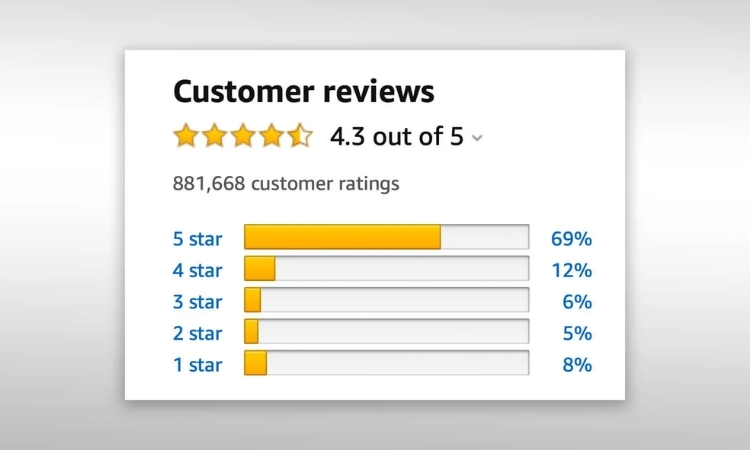
Act on Reviews and Customer Feedback
Customer feedback provides direct insight into why returns happen, so ignoring it leads to repeated issues and higher return rates over time. You should review feedback weekly, identify patterns in negative reviews, and update your listing or product accordingly, because if 20-30% of complaints mention the same issue, it indicates a clear root cause that needs to be fixed immediately.
Case Study: How Packaging and Setup Issues Drive “Defective” Returns in Electronics
“Defective” is often the most misleading return reason in the electronics category on Amazon, because a large portion of these returns are not caused by actual product failures but by shipping damage or user experience issues.
In many electronics return analyses, a typical pattern emerges where a significant share of returns labeled as “defective” are actually misclassified. In one dataset of 100 returned units categorized as defective, only 20% were confirmed to have genuine product issues after warehouse testing.
The remaining returns were primarily driven by non-product-related factors:
- Shipping damage (approx. 45%) caused by insufficient protective packaging during transit
- User setup errors (approx. 25%) where customers could not correctly pair or activate the device
- Battery misunderstandings (approx. 10%) where products were not pre-charged, leading to false assumptions of malfunction
Across these patterns, the root issue is not product quality, but expectation and experience gaps across fulfillment and onboarding.
To address these issues, common operational improvements observed in the category include:
- Reinforcing packaging with foam inserts or protective structures to reduce transit damage
- Adding QR-based setup guides to reduce user configuration errors
- Shipping partially pre-charged devices with clear “ready to use” communication
- Including troubleshooting cards to reduce unnecessary return initiation
- Using returnless refunds for low-value accessories to reduce operational costs
Across implementations like these, the impact typically shows a shift in return composition rather than product redesign. In many cases, “defective” return rates drop significantly once packaging protection and user onboarding are improved, even when the product itself remains unchanged.
Frequently Asked Questions About Amazon Return Rate
A good return rate on Amazon typically falls around 5%-10%, depending on the product category. Lower is always better, especially for low-margin or high-volume products.
If your return rate is too high, you may see reduced Buy Box eligibility, lower product ranking, and higher fulfillment costs. It can also signal listing or product issues that need immediate fixing.
Yes. A consistently high return rate can negatively impact your account health metrics, potentially leading to warnings, performance reviews, or restrictions if it is not improved over time.
Get Professional Help from Megaficus
Managing Amazon Return Rate requires a coordinated approach, from optimizing listing content and improving packaging quality to enhancing the post-purchase experience to reduce avoidable return triggers. If you need a structured strategy to reduce Amazon Return Rate and improve long-term FBA profitability, Megaficus can help you build a more effective and scalable solution.