How do successful Amazon sellers decide when to restock, discount, or scale a product without increasing risk? In this article, Megaficus explains what the Amazon sell-through rate is, how it works, and why it plays a critical role in inventory efficiency and sustainable growth on Amazon.
Quick Summary
- Amazon sell-through rate measures how quickly your available inventory converts into sales over a specific period, indicating how efficiently stock is being sold relative to inventory levels.
- How it’s calculated: Uses different formulas depending on whether you sell via FBA or self-fulfillment.
- Where to track: Available inside Seller Central through inventory and IPI performance reports.
- Common pitfalls: Can be distorted by seasonality, returns, delayed data, and fluctuating stock levels.
- Healthy performance range: A balanced rate signals efficient inventory without stockout risk.
- Category differences: Target ranges vary based on demand cycles and product behavior.
- Ways to improve: Focus on listing quality, pricing, ads, inventory control, and seasonal planning.
What Is Sell-Through Rate?
Sell-through rate measures how fast your inventory converts into sales during a specific timeframe, typically calculated on a monthly basis. This metric is displayed as a percentage, showing the proportion of units sold compared to your total available stock within that period.
By tracking this metric, you can identify whether your inventory levels are balanced, excessive, or insufficient. Consequently, it enables you to make smarter decisions regarding when to reorder products and how to adjust your pricing for better profitability.

Why Amazon Sellers Should Monitor Their Sell-Through Rate?
Understanding your sell-through rate provides critical insights that directly affect your profitability and operational efficiency on Amazon. Here’s why this metric matters for your business:
- Inventory efficiency: A strong sell-through rate confirms that your stock levels align with actual customer demand. This balance prevents you from tying up capital in excess inventory while ensuring you have enough products to meet sales opportunities.
- Storage cost reduction: Maintaining a healthy sell-through rate helps you avoid Amazon’s long-term storage fees, which accumulate when inventory sits unsold beyond 180 days. Faster-moving inventory means lower warehousing expenses and better cash flow.
- Improved visibility on Amazon: Amazon’s search algorithm favors products with higher sell-through rates, interpreting them as popular items worth promoting.
- Improved marketing tactics: Your sell-through data reveals when to adjust promotional strategies. Slow-moving products may require flash sales or targeted ad campaigns to accelerate sales, while fast-selling items benefit from sustained advertising to maintain momentum and maximize revenue potential.
How To Calculate Your Amazon Sell-Through Rate?
Although Amazon automatically calculates and displays your sell-through rate, understanding the formula helps you interpret the data and make better inventory decisions.
For FBA Sellers:
Amazon uses a specific calculation method for FBA accounts. The formula divides your total units shipped over the past 90 days by your average inventory level during that same timeframe.
Sell-Through Rate = Total units sold over 90 days / Average inventory level
For example, if you shipped 240 units while maintaining an average inventory of 180 units, your STR would be 1.33. This result indicates you’re selling faster than your typical stock level, which signals strong product performance.
Note: Amazon’s FBA calculation differs from standard sell-through formulas used in other retail contexts.
For Non-FBA Sellers:
If you fulfill orders yourself rather than using FBA, apply this alternative formula:
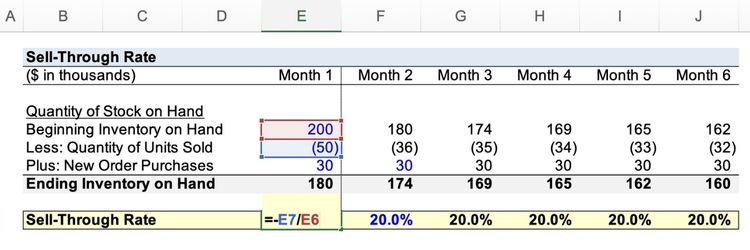
Sell-Through Rate = (Total units sold in given period / Inventory in given period) × 100
For instance, if you had 600 units in stock during June and sold 450 units that month, your calculation would be: (450/600) × 100 = 75%
Benchmark Standards:
In eCommerce, typical sell-through rates range between 40-80%. Any rate exceeding 80% is considered exceptionally strong, indicating high demand and efficient inventory management.
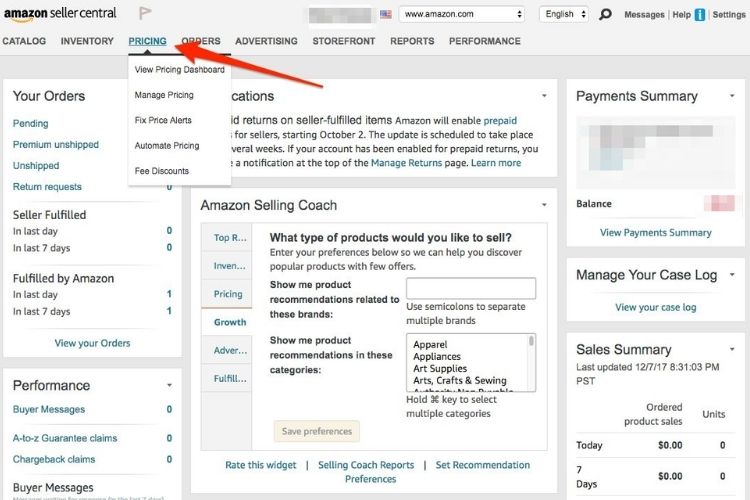
Find Your Sell-Through Rate In Amazon Seller Central
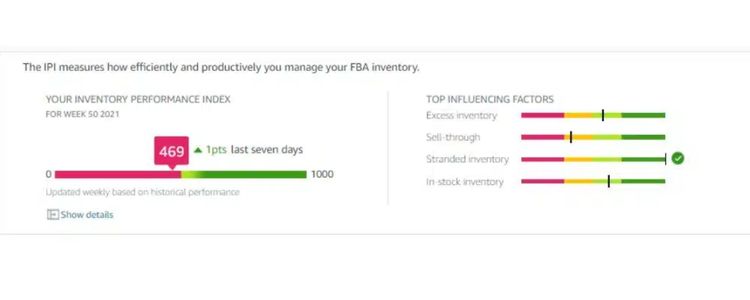
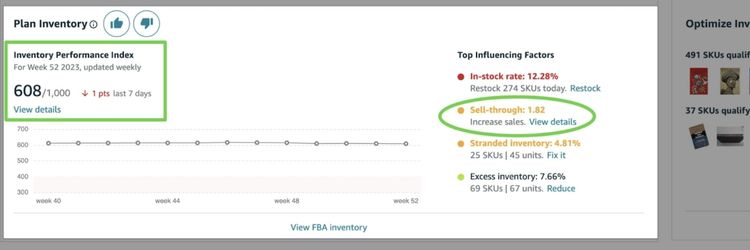
Amazon provides FBA sellers with an Inventory Performance Index (IPI) score that tracks how efficiently you manage your stock over time. Follow these steps to locate and analyze your sell-through rate:
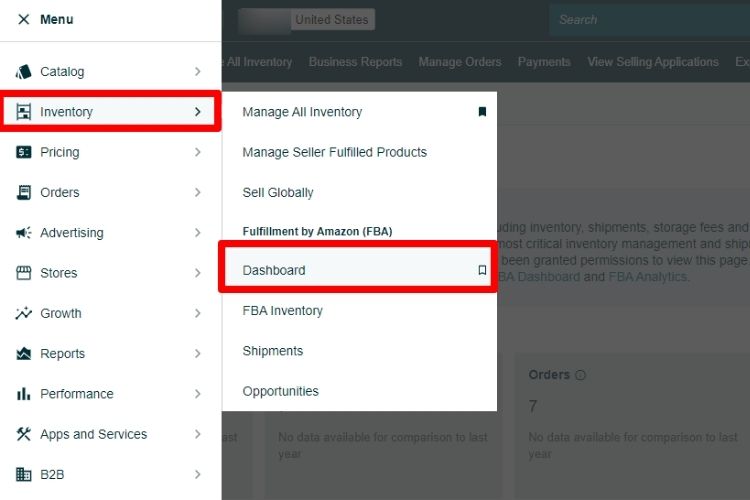
- Access your Inventory Dashboard: Navigate to Inventory > Dashboard in Seller Central to view your overall account metrics.
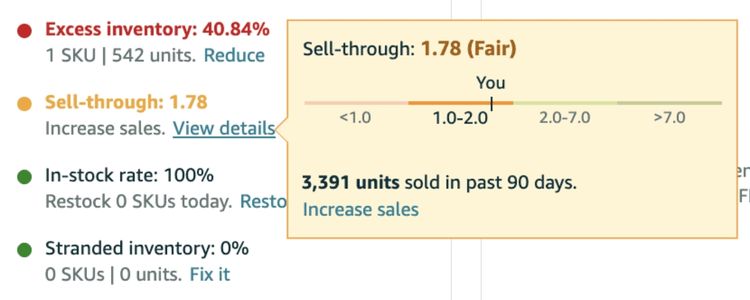
- Check your IPI score and STR: Your dashboard displays your current Inventory Performance Index alongside your total sell-through rate. For example, an STR of 0.85 falls below Amazon’s recommended range of 2.0 to 7.0.
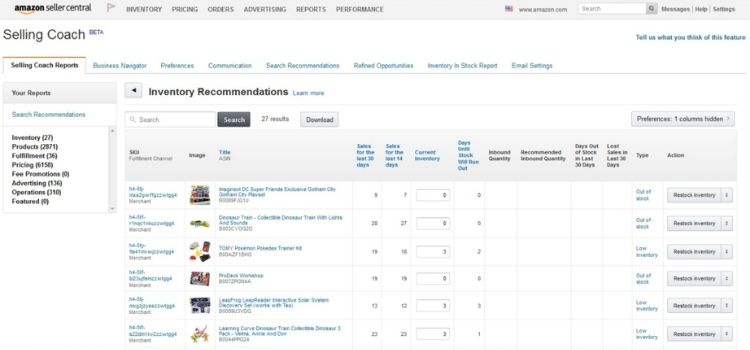
- Review excess inventory warnings: Look for your excess inventory indicator. A negative or high number signals that you have slow-moving products affecting your overall performance.
- View individual product performance: Click the “View details” button to access your FBA Inventory page, where you’ll see STR data for each specific product.
- Identify underperforming items: Use this breakdown to pinpoint which products need immediate attention through promotions, pricing changes, or inventory reduction strategies.
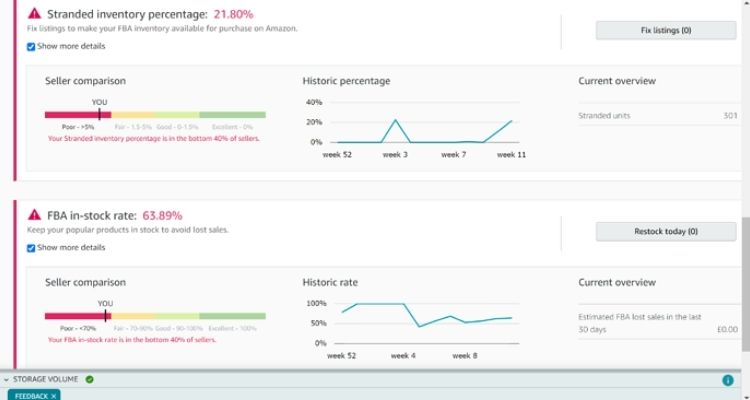
Common Challenges In Calculating Amazon Sell-Through Rate
Accurately calculating your sell-through rate presents several obstacles that can affect inventory decisions and business planning. Here are the most common challenges FBA sellers encounter:
- Changing inventory levels: Your stock constantly fluctuates due to ongoing restocking, customer returns, and unpredictable demand patterns. Since Amazon calculates STR based on warehouse inventory at specific intervals, these variations can distort your actual performance metrics.
- Delayed sales reports: Amazon’s reporting system doesn’t always update in real-time, which means you might be working with outdated information. Relying on lagging data can lead to poor decisions regarding reordering schedules and pricing adjustments.
- Seasonal demand changes: Products like holiday decorations or winter apparel experience dramatic sales spikes during specific periods. These seasonal variations can inflate your sell-through rate temporarily, making it difficult to establish consistent benchmarks for year-round planning.
- Impact of returns and refunds: High return rates skew your sell-through calculations because returned items don’t qualify as final sales. If you don’t account for returns properly, your STR may appear healthier than reality, leading to overconfident inventory decisions.
- Mixing FBA and FBM sales: Sellers using both Fulfillment by Amazon and self-fulfillment methods must track each channel separately. Combining all inventory in a single calculation produces inaccurate FBA-specific metrics, obscuring the true performance of your warehouse-stored products.
What Constitutes A Healthy Sell-Through Rate On Amazon?
Amazon categorizes sell-through rates into three distinct performance levels to help sellers evaluate their inventory efficiency:
- Below 2.0: An STR under 2.0 signals slow-moving inventory, putting you at risk of accumulating high long-term storage fees and tying up capital in unsold products.
- 2.0 to 7.0: This range represents healthy inventory turnover, indicating that your stock levels align well with customer demand and you’re managing inventory efficiently.
- Above 7.0: An STR exceeding 7.0 demonstrates fast-selling products and exceptional inventory management, though it comes with important considerations.
A strong sell-through rate directly contributes to your Inventory Performance Index (IPI) score, which Amazon uses to determine your storage limits and fee structure. Maintaining a healthy STR prevents unnecessary warehousing costs that result from overstocking and ensures your account remains in good standing.
However, experienced sellers note that sustaining an STR above 7.0 can be challenging and potentially risky.
For instance, if you maintain an average inventory of 120 units while selling 840 units over 90 days, you’d achieve a score of 7.0. This means you’re holding less than two weeks of stock at any moment, leaving you vulnerable to stockouts from shipping delays or unexpected demand surges.
Therefore, while a high STR appears favorable, balancing it with adequate safety stock is crucial to avoid losing sales opportunities.
Sell-Through Rate Benchmarks By Amazon Product Category
Sell-through rate expectations differ across product categories due to varying purchase patterns, seasonality, and inventory turnover cycles. Below are estimated benchmark ranges to help you evaluate your performance:
| Product Category | Estimated STR | Notes |
|---|---|---|
| Electronics & Computers | 3.5 – 5.5 | High demand and frequent product updates drive faster turnover |
| Clothing & Fashion | 2.0 – 6.0 | Highly seasonal; varies dramatically between trending and off-season items |
| Home & Kitchen | 2.5 – 4.0 | Moderate turnover with steady demand throughout the year |
| Beauty & Personal Care | 3.0 – 5.0 | Consumable nature leads to repeat purchases and consistent sales |
| Health & Household | 3.5 – 5.5 | Strong purchase intent and replenishment cycles maintain healthy rates |
| Toys & Games | 4.0 – 7.0+ | Extreme seasonality; peaks during holiday periods, drops significantly after |
| Books & Media | 1.5 – 3.0 | Lower turnover due to vast selection and niche audiences |
| Sports & Outdoors | 2.5 – 4.5 | Seasonal variations affect performance across subcategories |
Note: These ranges are general guidelines. Your actual STR depends on pricing, competition, and product quality. If your rate falls below your category’s benchmark, review your inventory management and promotional strategies.
How To Improve Your Amazon Sell-Through Rate
Improving your Amazon sell-through rate requires aligning listings, pricing, advertising, and inventory decisions with real customer demand, as outlined in the actionable strategies below.
Optimize Your Product Listings
A well-optimized product listing helps shoppers understand your product quickly and make a confident purchase decision.
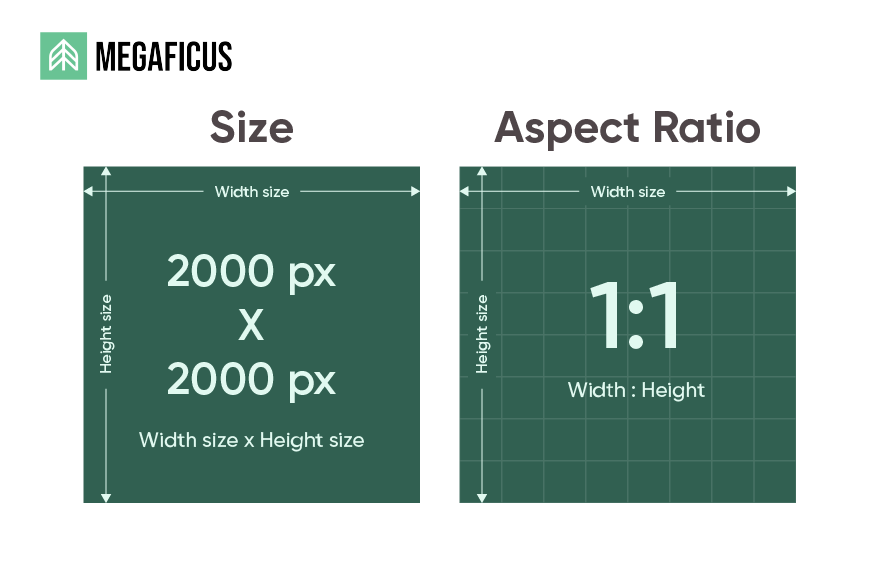
- High-quality product images: Use a main image at a minimum of 2000 × 2000 px on a pure white background so Amazon’s zoom feature is enabled.
- Clear, keyword-focused product title: Keep the title within 150–200 characters and structure it as Brand + Product Type + Primary Feature + Size/Variant.
- Benefit-driven bullet points: Use up to five bullets, each around 150–200 characters, and lead with the customer benefit rather than technical details.
- Informative, scannable product description: Clearly explain materials, dimensions, usage, and care instructions using short paragraphs or structured formatting. Avoid vague claims and focus on details that remove purchase doubts.
Price Competitively
Competitive pricing helps products sell faster by reducing hesitation during comparison, but it must still protect profit margins. Prices that are set too high can slow sales, while prices that are too low may increase sell-through at the expense of profitability. In practice, effective pricing focuses on balance rather than simply being the cheapest option.
To manage pricing effectively, sellers should monitor competitor prices regularly using tools such as Jungle Scout Product Tracker or Amazon’s pricing reports. These tools help identify pricing trends and allow timely adjustments as the market changes.
During periods of strong demand or seasonal peaks, sellers can rely more on value drivers like faster shipping, strong reviews, or customer service instead of aggressive price cuts to maintain both sell-through and margins.
Leverage Amazon Advertising
Amazon Advertising helps improve sell-through by increasing product visibility and bringing in high-intent shoppers. When ads are targeted correctly, they accelerate sales velocity and help inventory move faster. However, advertising should only be scaled after the listing is optimized to ensure traffic converts into sales.
Sellers can start with Sponsored Products to capture keyword-based demand, then expand to Sponsored Brands or Sponsored Display to increase reach and retarget shoppers. Focus on keywords and ads that generate consistent conversions, and adjust budgets based on performance rather than impressions alone.
Manage Inventory Effectively
Effective inventory management supports a healthy sell-through rate by keeping products available when customers are ready to buy. Stockouts interrupt sales momentum and hurt listing performance, while excess inventory ties up capital and slows overall turnover. Maintaining the right balance ensures sales flow consistently without unnecessary holding costs.
To do this, sellers should monitor inventory levels alongside sales velocity using tools like Amazon Seller Central inventory reports or inventory management software. Regularly reviewing sell-through data helps identify slow-moving or non-performing SKUs early, allowing sellers to adjust pricing, run promotions, or pause reorders before inventory becomes a liability.
Consider Seasonality
Effective inventory management on Amazon depends on accurately forecasting customer demand, which often changes due to seasonality, trends, and market shifts. Therefore, sellers need to plan stock levels based on specific buying periods rather than keeping inventory constant year-round.
For example, swimwear, sunscreen, or outdoor furniture typically see demand surge in summer, while heaters, blankets, and winter clothing peak toward the end of the year. In these cases, increasing inventory before the season starts and gradually reducing it afterward helps maintain a healthy sell-through rate.
>>> Read more: Amazon KPIs: Essential Metrics Every Seller Should Track
FAQs About Amazon Sell Through Rate
Amazon Sell-Through Rate measures how quickly your inventory sells compared to how much stock you have. It’s important because a higher rate signals strong demand, improves inventory health, and helps reduce storage fees.
Sell-Through Rate = (Units sold ÷ Average inventory on hand) × 100. Amazon typically calculates this over a 90-day period.
Generally, a sell-through rate above 2.0 is considered healthy. Fast-moving categories like beauty or household goods often perform higher, while bulky or seasonal items may perform lower.
You can improve it by optimizing listings, pricing competitively, running promotions, managing inventory wisely, and aligning stock levels with demand trends.
Get Professional Help from Megaficus
Understanding and managing the Amazon sell-through rate is not just about tracking a metric. It plays a critical role in guiding pricing decisions, inventory planning, and demand forecasting.
When sellers consistently monitor sell-through performance, they gain clearer visibility into product health, reduce excess inventory risk, and improve cash flow efficiency. Over time, this disciplined approach supports more stable and scalable growth on Amazon.
If you want to turn sell-through data into actionable inventory and pricing strategies, Megaficus offers data-driven insights and structured support to help Amazon sellers optimize performance and scale with confidence.