When conversion drops or a listing underperforms, metrics alone rarely explain why customers browse but do not buy. Amazon Insights solves this by letting sellers survey real Amazon shoppers directly, collecting first-party feedback tied to actual buying behavior. This guide breaks down how the program works, what it costs, and when it is worth the investment.
Quick Summary
- Amazon Insights is a paid survey tool in Seller Central that collects direct feedback from real Amazon shoppers, with three premade templates or a fully custom question option.
- How it works: Sellers target specific customer segments such as past buyers, browsers, or competitor customers, and receive a detailed response report once the campaign ends.
- When to use it: At $500 minimum per question, the tool makes the most sense for high-stakes decisions like product launches, bundle planning, or identifying conversion blockers.
- How to set it up: A few steps inside Seller Central cover choosing a topic, defining your audience, and setting your response target before submission.
- Other Insights tools: Amazon also offers Audience Insights via DSP, Category Insights in Seller Central, and Brand Analytics for broader market and customer research.
- How to maximize results: Real value comes from targeting the right segment, writing a sharp question, pairing results with Brand Analytics data, and sizing your response target to match the decision at hand.
What Is Amazon Insights?
Amazon Insights is a paid market research program built into Amazon Seller Central that lets sellers collect direct feedback from Amazon shoppers through custom surveys. Unlike third-party research tools, it pulls responses from real Amazon users who have actually browsed or purchased on the platform, giving sellers first-party data tied directly to buying behavior.
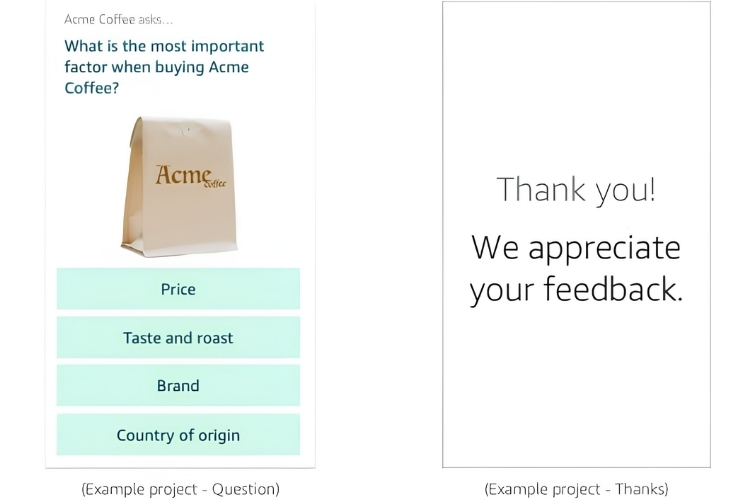
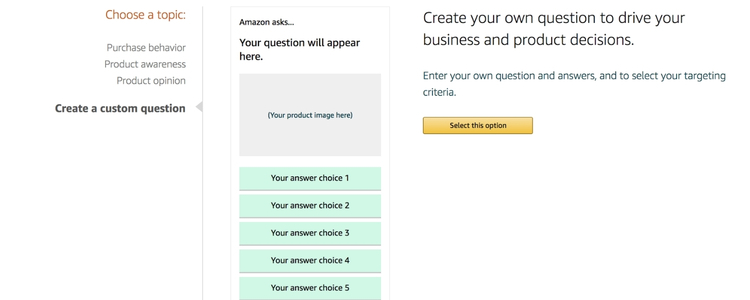
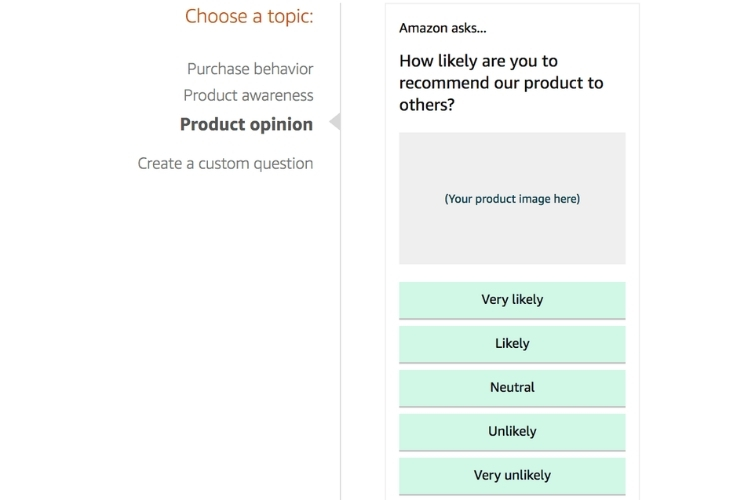
Sellers can choose from three premade question templates covering purchase behavior, product awareness, and product opinion, or write their own custom question. Each survey consists of a single multiple-choice question, and respondents select a single answer from the options provided by the seller.
How Amazon Insights Works?
Using Amazon Insights starts with logging into Seller Central and navigating directly to the Insights intake page, since the program does not appear as a visible link on the main dashboard. Sellers begin by choosing a target size, which can range anywhere from 100 to 2,500 respondents per survey. The standard project covers one question, while multi-question surveys are handled on a custom basis and are not yet widely available.
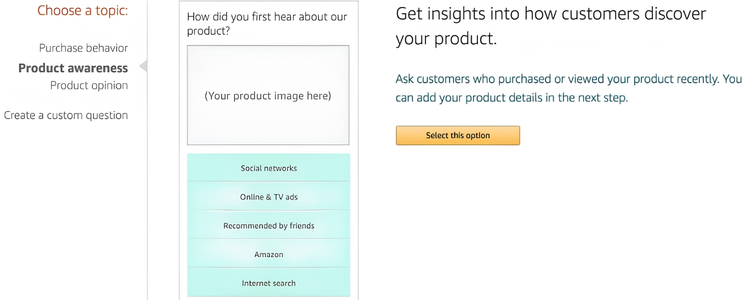
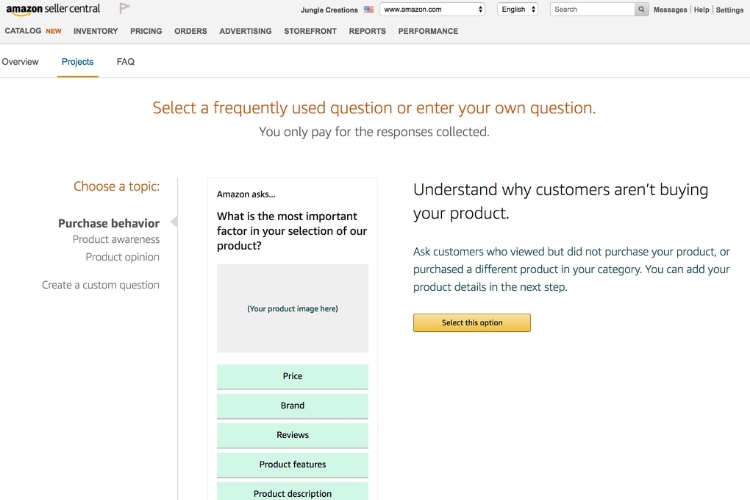
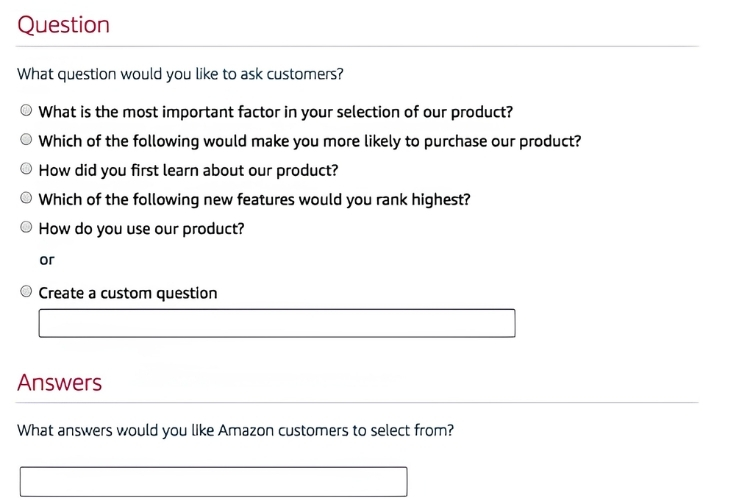
After setting the target size, sellers select a question type. Amazon provides three premade templates as a starting point:
- Purchase behavior
- Product awareness
- Product opinion
Alternatively, sellers can write a fully custom question, which is the better option if you want responses that are specific enough to act on.
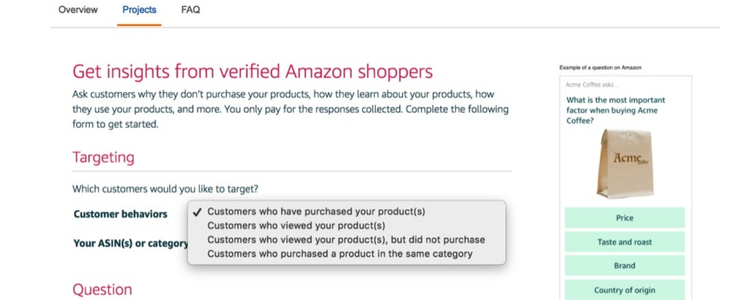
Once the question is ready, sellers define their respondent group by choosing one or more of the following customer segments that Amazon will distribute the survey to:
- Customers who purchased your products
- Customers who viewed your products
- Customers who viewed but did not buy
- Customers who bought a competing product in the same category
After submission, Amazon will follow up within a few days to confirm the details and final pricing. Once the campaign ends, Amazon sends a detailed report showing the number and percentage of respondents who selected each answer.
When Should You Use Amazon Insights?
Amazon Insights delivers the most value when a specific business decision requires direct input from real customers, not guesswork. The following are the situations where Amazon Insights gives you the data you need to make a confident decision:
- Bundle planning: Use survey data to identify which products customers actually buy together before a major sale or peak season, so your bundle is grounded in real purchase behavior.
- Category entry: Survey shoppers in an unfamiliar segment to understand what they are actively looking for before you commit to inventory or positioning.
- Pre-launch validation: Collect direct feedback on your pricing or marketing angle from real Amazon shoppers before committing to a full product rollout.
- Conversion diagnosis: Target the “viewed but did not buy” segment to pinpoint the exact reason customers are dropping off after viewing your listing.
- Channel performance: Ask customers how they first discovered your product to determine which marketing channels are driving real traffic and which are not.
- Satisfaction gaps: Survey past buyers to surface the real reason your ratings or reviews are falling below what you expect.
How to Set Up an Amazon Insights Survey That Generates Actionable Data?
To get started, you log into Seller Central and navigate to sellercentral.amazon.com/insights/intake/new. Each step below directly affects the quality of data you get back, so take time to set each one up deliberately:
- Choose a survey topic: Amazon provides three premade options: Purchase Behavior, Product Awareness, and Product Opinion. If none of these match your research goal precisely, select the custom option to build a question that generates more specific, actionable responses.
- Select your target audience: Choose the customer segment that aligns with the decision you are making. Target “viewed but did not buy” to diagnose conversion issues, “purchased your product” to measure satisfaction, or “bought a competing product” to understand what the category leader is doing right.
- Write your question: Choose one of Amazon’s premade questions or write a fully custom question. Before finalizing, ask yourself: if 60% of respondents pick one answer, do you know exactly what to do next? If not, rewrite the question until each answer option points to a clear action.
- Provide the answer options: Enter distinct, mutually exclusive answer choices so respondents are never torn between two similar options. Overlapping choices produce ambiguous data that is difficult to act on.
- Set your response target: Select a response count between 100 and 2,500. Match the size to the scale of the decision: a high-stakes product launch warrants more responses than a minor listing tweak.
Pros & Cons of Amazon Insights
Amazon Insights gives sellers a direct line to real customer data, but it comes with trade-offs that are worth understanding before you commit your budget. Here is an honest breakdown of where the program delivers and where it falls short.
Pros:
- Precise audience targeting: Amazon controls its own customer data, so your survey reaches exactly the segment you define. That level of precision is difficult to replicate with any third-party research tool.
- Product-specific feedback: Responses are tied directly to your product, making the data actionable for optimizing your listing, refining your detail page, or adjusting your marketing angle.
- Pre-launch validation: Sellers can survey shoppers before a product launches, making it a practical tool for validating demand, pricing, or positioning before a full rollout.
- Data-backed bundle planning: By asking what customers buy alongside your product, you can build bundles based on actual purchase behavior rather than assumptions.
- Channel discovery insights: Surveys can reveal how customers first find your product, giving you the data to decide which marketing channels are worth scaling.
Cons:
- High cost with no flexibility: At $5 per response and a minimum of 100 respondents, the entry cost is $500 for a single question. Amazon does not offer bulk discounts regardless of project size.
- Limited to one question per survey: The standard project covers only one question, which restricts how much ground you can cover in a single campaign.
- Opinion data, not behavioral data: Responses reflect how customers think they behave, not how they actually behave, which can introduce bias into your conclusions.
The Best Amazon Insights Tool to Power Your Research
Beyond the core survey program, Amazon offers several other tools under the Insights umbrella that serve different research needs, from audience analysis to category performance tracking.
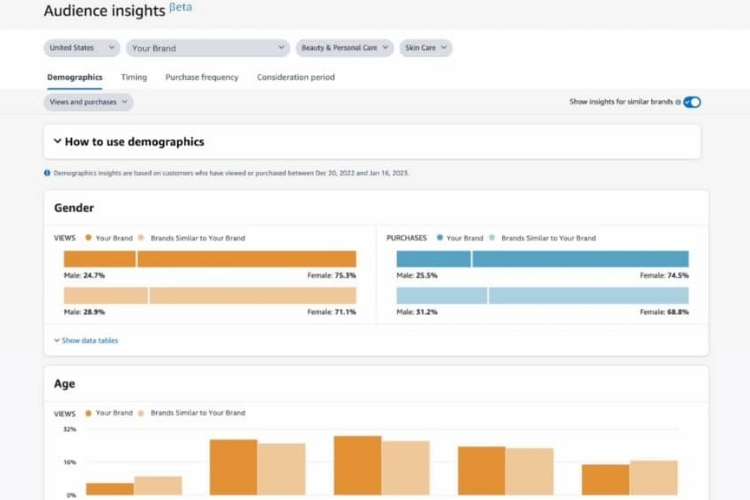
Understand Your Audience With Amazon Audience Insights
Amazon Audience Insights is available exclusively to sellers running campaigns through Amazon DSP. This tool provides data on who is engaging with your ads and products, giving you the customer intelligence needed to sharpen your targeting and marketing decisions. Sellers can access it by navigating to the Campaign Manager section within the DSP Console.
Amazon Audience Insights organizes customer intelligence into four core data points that sellers can use to make sharper targeting and marketing decisions:
- Demographics: View customer age, gender, income level, and location to build campaigns that speak directly to the right audience. When data shows that 70% of buyers are women aged 25 to 34 with mid-to-high income, shifting ad creative and messaging to match that profile will outperform any broad, untargeted campaign.
- Shopping patterns: Surface buying habits, purchase frequency, and product preferences to make smarter inventory decisions. When purchase frequency data shows a consistent 6-week buying cycle in your category, that signal gives sellers a concrete basis for timing restock orders and promotional pushes.
- Engagement analysis: Measure how customers interact with your listings and ads. Strong click-through rate paired with low time-on-page points to a specific problem: the main image is attracting clicks, but the listing content is not holding attention, giving sellers a clear fix rather than a broad optimization guess.
- Personalized marketing: Build targeted campaigns based on detailed audience profiles. Sellers who identify a segment of high-income repeat buyers can direct an exclusive promotion specifically at that group, rather than applying a blanket discount that cuts margin across all customers.
Spot Market Opportunities With Amazon Category Insights
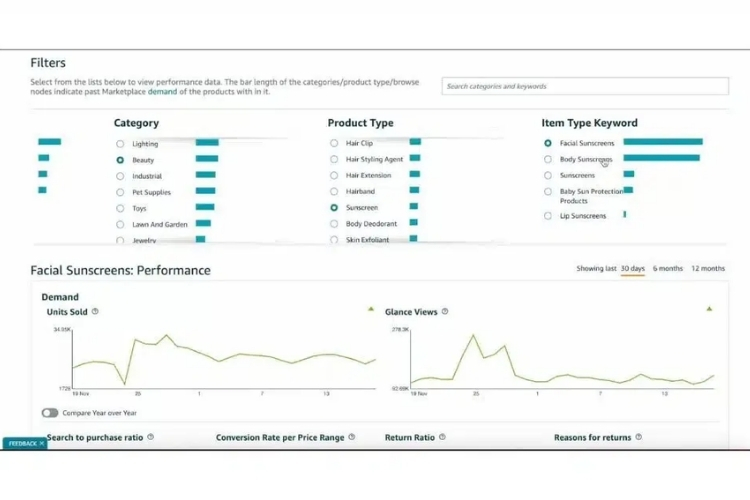
Amazon Category Insights, also known as Amazon Retail Insights, is a free tool in the Marketplace Product Guidance section of Seller Central. It gives sellers a data-driven view of how specific product categories are performing, covering demand trends, competitive dynamics, and customer behavior.
Amazon Category Insights organizes category data into four actionable areas that sellers can use to make smarter inventory, pricing, and competitive decisions:
- Demand visualization: View historical demand data to spot seasonal trends before they affect inventory planning. A consistent November spike followed by a January drop, for instance, gives sellers a concrete basis for timing purchase orders and avoiding overstock.
- Dashboard analytics: Access category-wide performance data in one place. When glance views are rising, but conversion rates stay flat, that gap points to a listing quality problem that sellers can address before competitors do.
- Vital metrics: Track conversion rates, return ratios, and purchase patterns to assess category performance. A return ratio significantly above the category average signals a product expectation gap that sellers can address through better listing accuracy or product differentiation.
- Competitive landscape: Surface average ratings and ad spend across the category to identify market gaps. High ad spend paired with below-average ratings signals an opening for sellers who can enter with a stronger product and a more accurate listing.
Track Performance Decisions With Brand Analytics
Brand Analytics is a free tool available to sellers enrolled in Amazon Brand Registry with a Professional selling account and Brand Representative status. It provides in-depth data on customer behavior, search performance, and competitive positioning. To access it, navigate to Brands, then Brand Analytics from the Seller Central main menu.
Brand Analytics is built around five core dashboards that cover different aspects of customer and market intelligence:
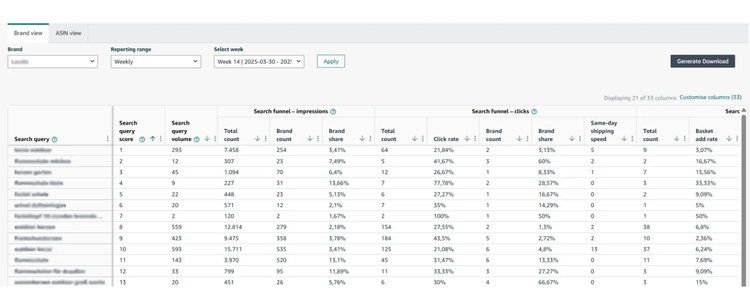
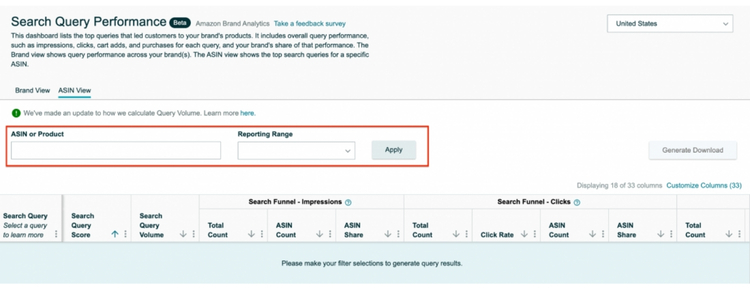
- Search query performance: See how often your products appear in search results, along with clicks, click-through rates, cart adds, purchases, and conversion rates for any selected time frame. High impressions paired with a low click-through rate point directly to a main image or title problem, not a pricing issue.
- Market basket analysis: Identify which products customers frequently buy alongside yours. When data shows that 30% of buyers consistently add a specific complementary product to their cart, that pattern is a data-backed signal to build a bundle rather than guess at what pairs well.
- Repeat purchase behavior: Track how often customers return to buy again. A long repurchase interval compared to category benchmarks indicates that customers are not building a habit around the product, which points to a retention gap worth addressing through follow-up messaging or subscribe and save.
- Demographics: Access audience data including age, gender, income level, and household composition. When income data shows that the majority of buyers fall in a higher bracket than your current pricing reflects, sellers have a concrete basis for testing a premium positioning rather than competing on price.
- Amazon Attribution: Measure how non-Amazon channels, such as Facebook ads or website traffic, contribute to your Amazon sales using unique tracking URLs. When Attribution data shows that Instagram traffic generates clicks but zero purchases, sellers can reallocate that budget to a channel that is actually converting.
How to Use Amazon Insights Effectively
Spending $500 on a single survey question means every element of your campaign needs to work together. Here is how to make sure your Amazon Insights results are worth the investment.
Match Your Segment to the Decision You Are Making
The segment you target determines how useful your results actually are. Targeting the wrong group produces data that looks informative but does not answer the question you actually need to make a decision.
Sellers can use the following table as a quick reference to match the right segment to their research goal:
| Decision | Target Segment |
|---|---|
| Diagnose conversion drop | Viewed but did not buy |
| Measure post-purchase satisfaction | Purchased your product |
| Understand first impressions | Viewed your product |
| Benchmark against competitors | Bought a competing product |
For example, one seller running a phone stand listing noticed high traffic but low conversion. After surveying the “viewed but did not buy” segment, the results showed that most shoppers were unsure whether the stand was compatible with their phone model. That data pointed directly to a listing content fix, not a price drop.
Write One Question That Points to a Clear Action
Amazon Insights allows only one question per survey, so the question needs to be specific enough that every answer option leads to a clear next step. Before submitting, sellers should ask themselves: if 60% of respondents pick one answer, do you know exactly what to do next? If the answer is no, rewrite the question before committing the budget.
Here is the difference between a weak and a strong question:
- Weak: “What do you think about our product?”
- Strong: “What was the main reason you did not complete your purchase after viewing this product?” with answer options such as: price too high/unsure about compatibility / did not trust the brand / found a better alternative / just browsing.
Each answer option in the strong version points to a specific fix, so that sellers can act on the results without further guesswork.
Use Insights to Confirm What Brand Analytics Already Flags
Brand Analytics can show you that a product has strong impressions but weak conversion, but it cannot tell you the reason behind that gap. Amazon Insights fills that gap by collecting direct feedback from the exact customer segment that browsed but did not buy.
For example, if Brand Analytics shows that click-through rate drops sharply after week 3 of a new launch, sellers can follow up with an Insights survey targeting the “viewed but did not buy” group with a question like: “When you saw this product, what stopped you from clicking to learn more?” If 54% of respondents select “the main image did not show how the product works”, sellers have a clear, data-backed fix without any further guesswork.
Using both tools together prevents sellers from spending $500 on a question that free Brand Analytics data could have already answered. It also ensures every survey investigates a confirmed data gap rather than a hunch, so the investment is directly tied to a real business decision.
FAQs About Amazon Insights
Amazon Insights charges $5 per response with a minimum of 100 respondents, making the entry cost $500 per question. The investment makes sense for high-stakes decisions that free tools like Brand Analytics cannot answer.
Amazon Insights does not appear on the main dashboard. Navigate directly to sellercentral.amazon.com/insights/intake/new to access it.
Amazon offers three premade templates covering purchase behavior, product awareness, and product opinion, or sellers can write a fully custom question. Each survey is limited to one multiple-choice question with a single answer selection per respondent.
Get Professional Help from Megaficus
Amazon Insights is a powerful research tool, but getting the most out of it requires knowing the right questions to ask, the right segments to target, and the right moments to use it alongside free tools like Brand Analytics. When used strategically, a single well-designed survey can save you from costly missteps and give your business decisions a foundation built on real customer input.
If you need expert guidance on optimizing your Amazon strategy or making sense of your store’s data, the team at Megaficus is ready to help.