You’ve just launched a product on Amazon but have no idea which keywords are driving traffic, who your real competitors are, or why shoppers keep choosing other brands over yours. Instead of guessing, Amazon Brand Analytics gives you the first-party data you need to answer all of these questions, and it’s completely free for brand-registered sellers.
Quick Summary
- Amazon Brand Analytics is a free Seller Central tool exclusively for Amazon Brand Registry members, giving brand owners direct access to first-party customer and market data.
- Who can use it: Brand owners or authorized representatives with a Professional selling account and an active Brand Registry enrollment.
- How it works: Select a date range, enter keywords or ASINs, and pull up the data you need across available dashboards.
- Key benefits: Free to use, uncovers high-converting keywords, informs marketing strategies, reveals customer shopping behavior, and requires no technical expertise.
- 5 core reports: Search Terms, Repeat Purchase Behavior, Market Basket Analysis, Item Comparison and Alternate Purchase Behavior, and Demographics.
- Key metrics: Click Share, Conversion Share, Search Frequency Rank, and Top Clicked ASINs.
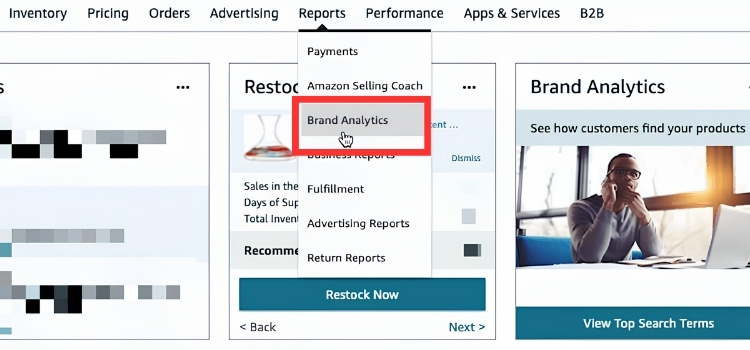
- How to access: Log in to Seller Central, hover over Brands, and select Brand Analytics from the dropdown.
- How to apply it: Cross-reference reports, review data regularly, optimize listings, build bundles, support R&D, and sharpen PPC campaigns with real data.
What Is Amazon Brand Analytics?
Amazon Brand Analytics (ABA) is a built-in tool available in both Amazon Seller Central and Amazon Vendor Central, exclusively for members of the Amazon Brand Registry. ABA organizes data into five key reports that brands can use to refine their product lineup and sharpen their marketing and advertising strategies:
- Search Terms
- Repeat Purchase Behavior
- Market Basket Analysis
- Item Comparison and Alternate Purchase Behavior
- Demographics
Who Is Eligible to Access Amazon Brand Analytics?
Not every Amazon seller can use ABA, as this tool is designed exclusively for verified Amazon brands. To gain access, you need to meet the following requirements:
- Be a brand owner or authorized brand representative: You must be either the direct owner of the brand or a legally authorized representative acting on its behalf.
- Have a Professional Selling Account: This is a paid monthly subscription account on Amazon that unlocks advanced features beyond what an Individual account offers.
- Successfully enroll in Amazon Brand Registry: This is the most critical prerequisite. To qualify for Brand Registry, your trademark must meet these conditions:
- Hold an active, registered trademark issued by a government intellectual property office, such as the USPTO, if you sell in the U.S. market.
- In certain cases, Amazon may accept a pending trademark application for Brand Registry enrollment, though a fully approved trademark makes the process faster and more reliable.
- If you want to accelerate your U.S. trademark registration and gain earlier access to Brand Registry, Amazon’s IP Accelerator program is worth considering.
- Have “Amazon Brand Analytics” access enabled in Global User Permissions within Seller Central: Even after your brand is enrolled in Brand Registry, you still need to verify that your user account has been granted the necessary permissions to view ABA reports.
How Amazon Brand Analytics Actually Works?
So, how does Amazon Brand Analytics actually work? To retrieve data on ABA, you need to select a specific date range from the dropdown menu, then enter relevant keywords, search terms, product names, or ASINs to pull up the results you need.
Alternatively, you can browse through different product categories to narrow down your search criteria and retrieve the most relevant data.
Key Benefits of Using Amazon Brand Analytics
ABA goes beyond surface-level metrics by giving you the specific data needed to make smarter decisions across every aspect of your Amazon business.
Completely Free to Use
ABA is available at no cost to all brands enrolled in Amazon Brand Registry. Instead of paying for third-party analytics tools to gather market data, competitor insights, and keyword research, you can access all of this directly through ABA without spending an extra budget.
Uncover High-Potential Keywords for Your Listings
ABA reveals the exact search terms your target customers use when looking for products like yours. Through the Search Frequency Rank column, you can identify which keywords drive the most traffic, then prioritize them in your listings to improve organic rankings and attract more relevant buyers to your store.
Build Smarter Marketing Strategies with Real Data
Instead of guessing what works, ABA shows you exactly what your competitors are doing to promote their products. With this data in hand, you can identify the gaps in your current strategy and build more targeted marketing and advertising campaigns that reach the right audience at the right time.
Understand How Your Target Customers Shop
ABA gives you a clear picture of your customers’ buying behavior. For example, if you sell watches and ABA reveals that “stylish watches for teens” is a top-performing keyword, you can increase your ad bids for that term and tailor your store content to appeal to both teenagers and their parents, two distinct but equally valuable buyer segments.
Get Actionable Insights on Product Performance
ABA helps you pinpoint the exact search terms that are currently driving sales for your products. For instance, if shoppers consistently find your summer clothing brand through the keyword “best summer clothing,” you know that ranking for this term is directly tied to your revenue, and you can double down on it across your listings and ad campaigns.
Easy to Navigate Even for New Sellers
Despite the volume of data it provides, ABA is built with a straightforward interface that does not require any technical expertise. Any brand owner, including those just starting on Amazon, can navigate the tool and extract meaningful insights without needing professional training.
5 Essential Reports Inside Amazon Brand Analytics
Each report inside ABA is designed to answer a different business question, and knowing what each one covers helps you extract the most relevant insights for your strategy.
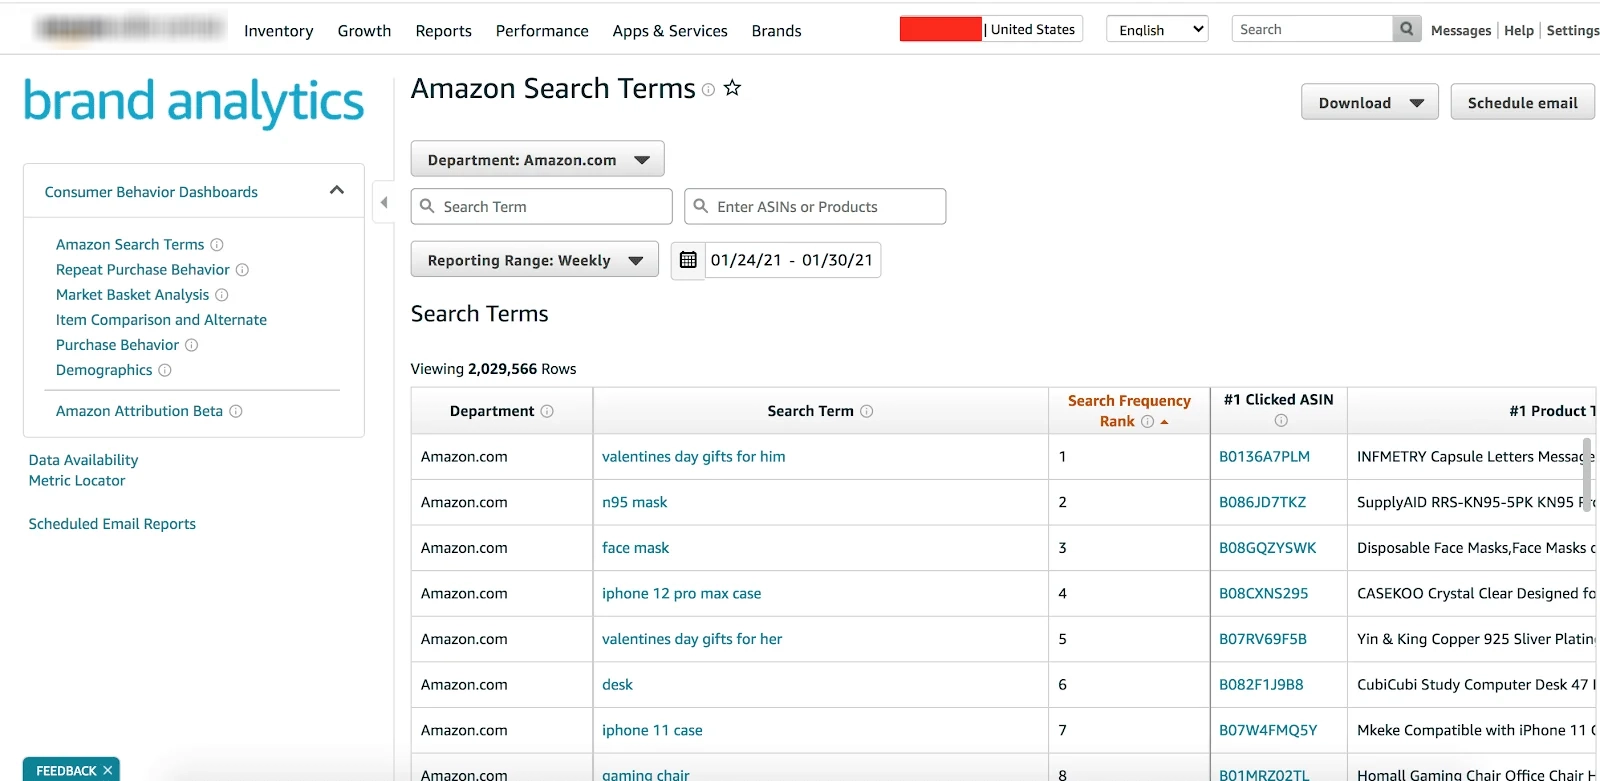
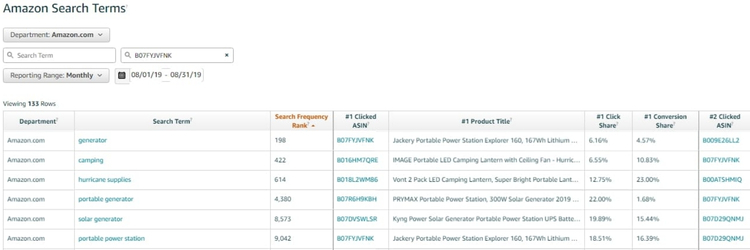
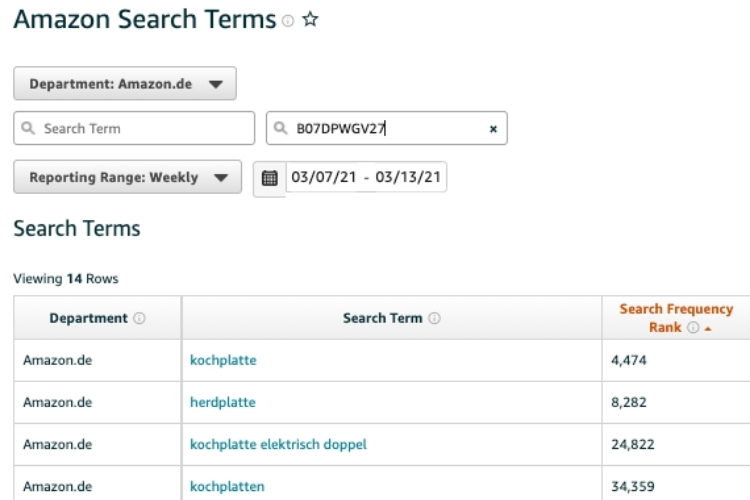
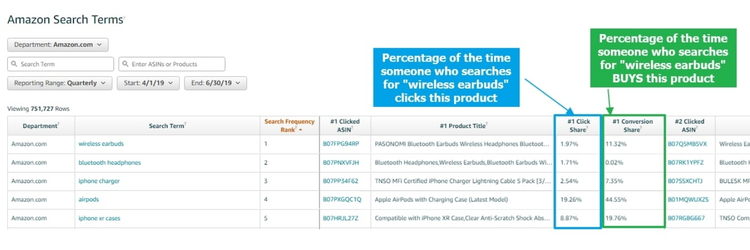
Amazon Search Terms Report
The Amazon Search Terms Report gives you direct visibility into how shoppers search for products like yours, and even how they find your competitors. Within this report, you will find four key data points:
- Search Terms: The exact words and phrases customers type into Amazon’s search bar when looking for products in your category.
- Search Frequency Rank: A ranking that shows how popular a search term is relative to others, helping you identify which keywords matter most for your listing’s visibility.
- Click Share: The percentage of clicks a specific product receives after shoppers use a particular search term, compared to clicks on all other products appearing for that same term.
- Conversion Share: The percentage of purchases a specific product generates from a particular search term, compared to total purchases made by shoppers who used that same term.
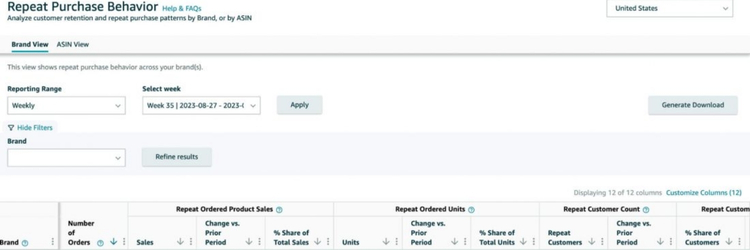
Repeat Purchase Behavior Report
The Repeat Purchase Behavior Report helps you understand how often Amazon shoppers come back to buy your products again. It tracks four key metrics:
- Orders: The total number of orders placed for your products, covering both first-time and repeat purchases.
- Unique Customers: The total count of individual customers who have purchased from you, including both new and returning buyers.
- Repeat Customers: The percentage of your unique customers who have made more than one purchase, giving you a clear view of your brand’s customer retention rate.
- Repeat Purchase Ordered Product Sales: The percentage of your total sales generated specifically from repeat purchases, also expressed as a monetary value for easier reference.
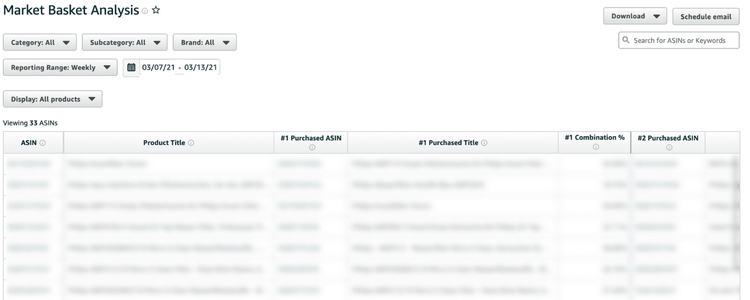
Market Basket Analysis Report
The Market Basket Analysis Report shows brand owners which other products Amazon shoppers frequently purchase alongside their own, providing a broader view of customer buying patterns. It surfaces three key data points:
- Amazon Product ASIN: The unique identification number of products that shoppers most commonly buy together with yours.
- Product Title: The name of those frequently co-purchased products, helping you quickly identify what they are and who sells them.
- Combination Rate: The percentage of orders where your product was purchased together with another seller’s product, giving you a clear measure of how often your items are bundled with others in a single transaction.
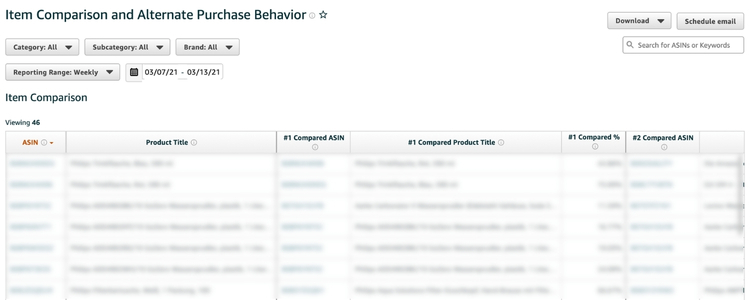
Item Comparison and Alternate Purchase Behavior Report
This report reveals the top three products that shoppers compare against yours or choose to buy instead, giving you a direct window into where you are losing potential sales to competitors. It provides six data points split across two categories:
Comparison Data:
- Compared ASIN: The unique identifier of the competing product that shoppers most frequently compare with yours.
- Compared Product Title: The name of that competing product, helping you quickly identify who you are being measured against.
- Compared Percentage: The percentage of times shoppers viewed a competitor’s product alongside yours before making a decision.
Purchase Data:
- Purchased ASIN: The unique identifier of the competing product that shoppers ultimately chose to buy instead of yours.
- Purchased Product Title: The name of the product that won the sale over yours.
- Purchased Percentage: The percentage of times shoppers picked a competitor’s product over yours after comparing the two.
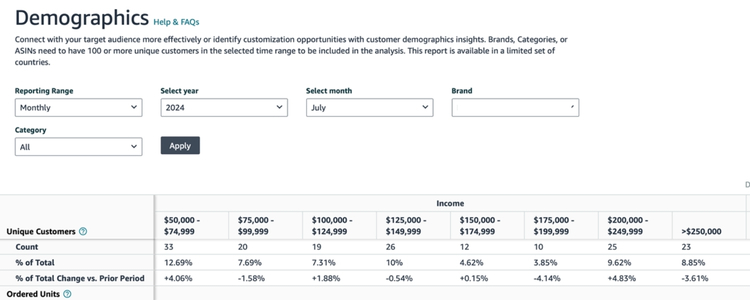
Demographics Report
The Demographics Report helps sellers build a clear picture of exactly who is buying their products by breaking down the customer base across the following attributes:
- Age: The age range of shoppers purchasing your products.
- Education: The highest level of education attained by your buyers.
- Annual Income: The average yearly income of your customer base.
- Gender: The gender distribution of shoppers buying your products.
- Marital Status: Whether your buyers are married or single.
- Unique Customers: The total number and percentage of shoppers associated with each demographic segment.
- Product Sales: The number and percentage of sales generated from each demographic group.
- Ordered Units: The number and percentage of units ordered by shoppers within each demographic category.
Key Metrics to Track in Amazon Brand Analytics
ABA measures search performance, customer interest, and purchasing behavior in detail, giving you the data foundation needed to evaluate product effectiveness and refine your overall business strategy.
- Click Share: The percentage of clicks a specific ASIN receives out of all clicks generated by a particular search query. A higher click share indicates that your product stands out more strongly against competitors on the search results page.
- Conversion Share: The percentage of purchases a specific product generates from a particular search query compared to total orders from that same query. A high conversion share signals that your product effectively convinces shoppers to buy, which typically reflects strong product quality and relevance to customer needs.
- Search Frequency Rank: A ranking that measures how popular a specific search query is on Amazon. The higher the rank, the greater the search volume behind that keyword, meaning more potential customers are actively looking for products in that space.
- Top Clicked ASINs: A list of products that receive the most clicks from a specific search query. By analyzing which ASINs dominate this list, you can identify what makes competing products more attractive and use those insights to strengthen your own listings and improve your competitive position.
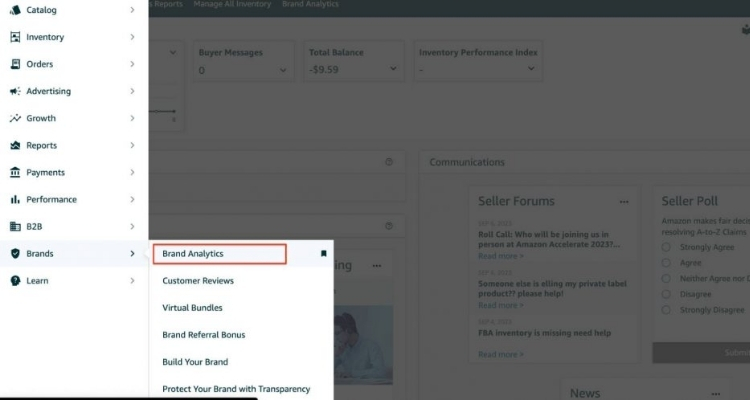
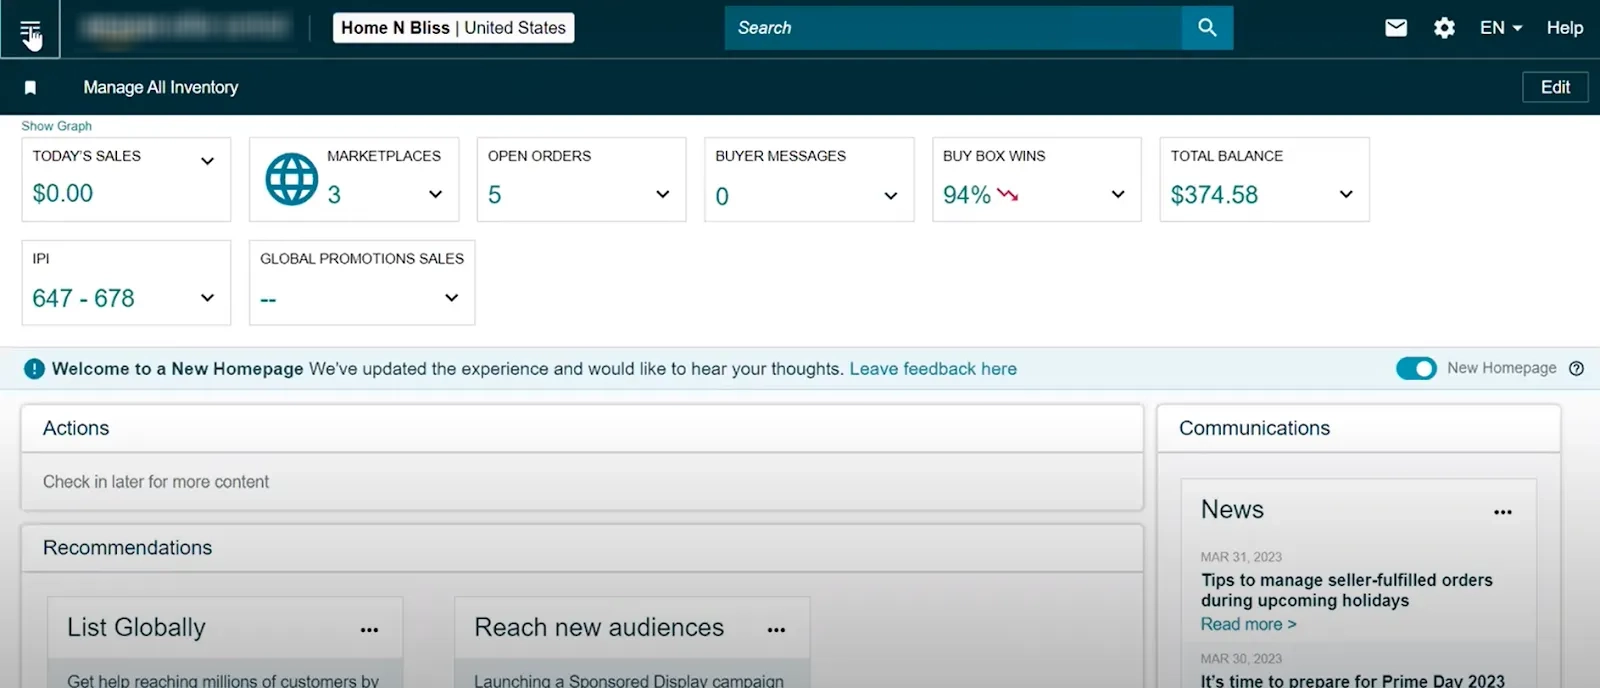
How to Access Amazon Brand Analytics in Seller Central?
To get started with ABA, follow these three straightforward steps:
- Step 1: Log in to your Amazon Seller Central account.
- Step 2: On the main menu, hover over “Brands” and select “Brand Analytics” from the dropdown. Alternatively, you can also find it under the “Reports” tab, depending on your interface.
- Step 3: Once inside, explore the available dashboards and begin pulling the data you need.
How to Leverage Amazon Brand Analytics to Grow Your Business
Having access to ABA data is only half the equation, as the real value comes from knowing how to apply it across your business in a way that drives measurable growth.
Combine Data from Multiple Reports
Cross-referencing data across multiple reports gives you the most complete picture of your market and customers. Start with the Search Term Report to understand what shoppers are actively searching for, then layer in Market Basket Analysis to see which products they frequently buy together.
Finally, consulting Item Comparison and Alternate Purchase Behavior helps you identify exactly where competitors are winning sales over you, allowing you to make business decisions grounded in accurate, multi-dimensional data.
Track Trends With Periodic Analysis
Reviewing ABA on a regular schedule is essential to staying competitive as Amazon data shifts constantly. For fast-moving categories, a weekly review helps you catch sudden changes before they impact your sales, while a monthly analysis is sufficient for more stable product lines.
For example, a sudden drop in the Search Frequency Rank of a keyword you rely on could signal a new competitor entering the market or a shift in shopper demand that requires a fast strategic response.

Turn Data Into Concrete Actions
Translating ABA insights into specific, executable actions is what separates brands that grow from those that stagnate:
- Optimize your product listings: If the Search Term Report shows that “soft cotton t-shirt” has a high conversion rate and strong search volume, ensure that the keyword appears in your title, bullet points, and description to improve organic ranking and attract the right buyers.
- Create product bundles: If Market Basket Analysis reveals that customers frequently buy your insulated bottle alongside a bottle brush from another seller, consider building a Virtual Bundle that includes both items under your brand, as this is a straightforward cross-selling strategy that directly increases average order value.
- Strengthen your competitive position: If Item Comparison and Alternate Purchase Behavior show that shoppers are consistently choosing a competitor’s product over yours, study their listing closely, since the gap may come down to stronger images, a more compelling description, or a more competitive price point.
Use Analytics To Support Product Research And Development
Through Market Basket Analysis, you can identify complementary products that your customers are already buying from other sellers, which reveals clear opportunities to expand your product line.
Furthermore, Item Comparison data helps you spot market gaps where competitor products fall short of customer expectations, giving you a concrete direction for developing new products that are more competitive from day one.
Optimize Your Amazon PPC Campaigns With ABA Data
By using the Search Term Report, you can identify keywords with the highest conversion rates and prioritize them in your Sponsored Products campaigns, ensuring your ad budget is concentrated on terms proven to drive purchases. In addition, Demographics data lets you build a precise profile of your target buyer, helping your ads reach the shoppers most likely to convert and reducing wasted spend in the process.
Frequently Asked Questions About Amazon Brand Analytics
To access ABA, you need a Professional seller account and must be enrolled in Amazon Brand Registry with an active or pending trademark. Additionally, your account must hold an internal role such as a brand owner, agent, or authorized representative responsible for selling the brand.
As of 2026, ABA offers between 5 and 8 reports and dashboards, depending on how they are categorized. These reports provide aggregated, first-party data covering customer behavior, search patterns, and competitive performance across your product catalog.
Brand owners can maximize ABA’s value by using the Search Query Performance dashboard to optimize keywords, applying Market Basket Analysis to spot bundling opportunities, and leveraging Demographics data to sharpen ad targeting. Reviewing these reports regularly helps you refine your listings and stay ahead of competitors.
Get Professional Help from Megaficus
Amazon Brand Analytics hands you the data most sellers never think to use, from the exact keywords driving purchases to the competitors quietly stealing your sales. Putting this data to work consistently is what separates brands that scale from those that plateau. If you need expert guidance to turn ABA insights into a winning Amazon strategy, the team at Megaficus is ready to help.