
Most Amazon sellers track their sales daily but rarely understand what’s driving the numbers. Amazon Seller Insights gives brand-registered sellers direct access to the data behind every search, click, and purchase, turning guesswork into evidence-backed decisions. This guide breaks down what these tools offer and how to use them to grow your sales.
What Is Amazon Seller Insights?
Amazon Seller Insights is a suite of AI-powered analytics tools built into Amazon Seller Central, giving third-party sellers access to data on customer behavior, market trends, and product performance.
Built around three core tools, Amazon Seller Insights covers Category Insights for market trend analysis, Product Opportunity Explorer for spotting demand gaps, and Returns & Recovery for tracking return patterns.
Who Can Access Amazon Seller Insights?
Access to Amazon Seller Insights is primarily restricted to professional sellers enrolled in the Amazon Brand Registry, and the following groups are the key users who can access these tools:
- Brand Representatives: Individuals assigned to a brand within the Brand Registry, with access to Search Query Performance and Catalog Performance dashboards.
- Professional Sellers: Sellers with professional accounts who can access general business, inventory, and FBA analytics, with permissions set by the account administrator.
- Authorized Third-Party Developers: Those using the Selling Partner API (SP-API) to access seller data programmatically.
- User-Permitted Staff: Employees, contractors, or co-owners granted access to specific reports via Seller Central’s “User Permissions” settings.
Amazon Seller Insights Vs. Amazon Brand Analytics: What’s The Difference?
While both tools live inside Amazon Seller Central, Amazon Seller Insights and Amazon Brand Analytics serve different purposes and target different user groups. The table below breaks down the key differences between the two:
| Amazon Seller Insights | Amazon Brand Analytics | |
|---|---|---|
| Access | Available to all professional sellers | Requires Amazon Brand Registry enrollment |
| Focus | Internal performance data (sales, inventory, profit) | Market-level data (search trends, competitors, customer behavior) |
| Purpose | Operational management and accounting | Strategic planning, marketing, and SEO |
| Key Tools | Sales Dashboard, Inventory Reports, FBA Analytics | Search Terms Report, Demographics Report, Item Comparison Report, Market Basket Report |
Key Features Of Amazon Seller Insights
Understanding what each tool within Amazon Seller Insights actually does is the first step toward using the data effectively, and the following features show exactly what sellers have access to.
Customer Behavior Data
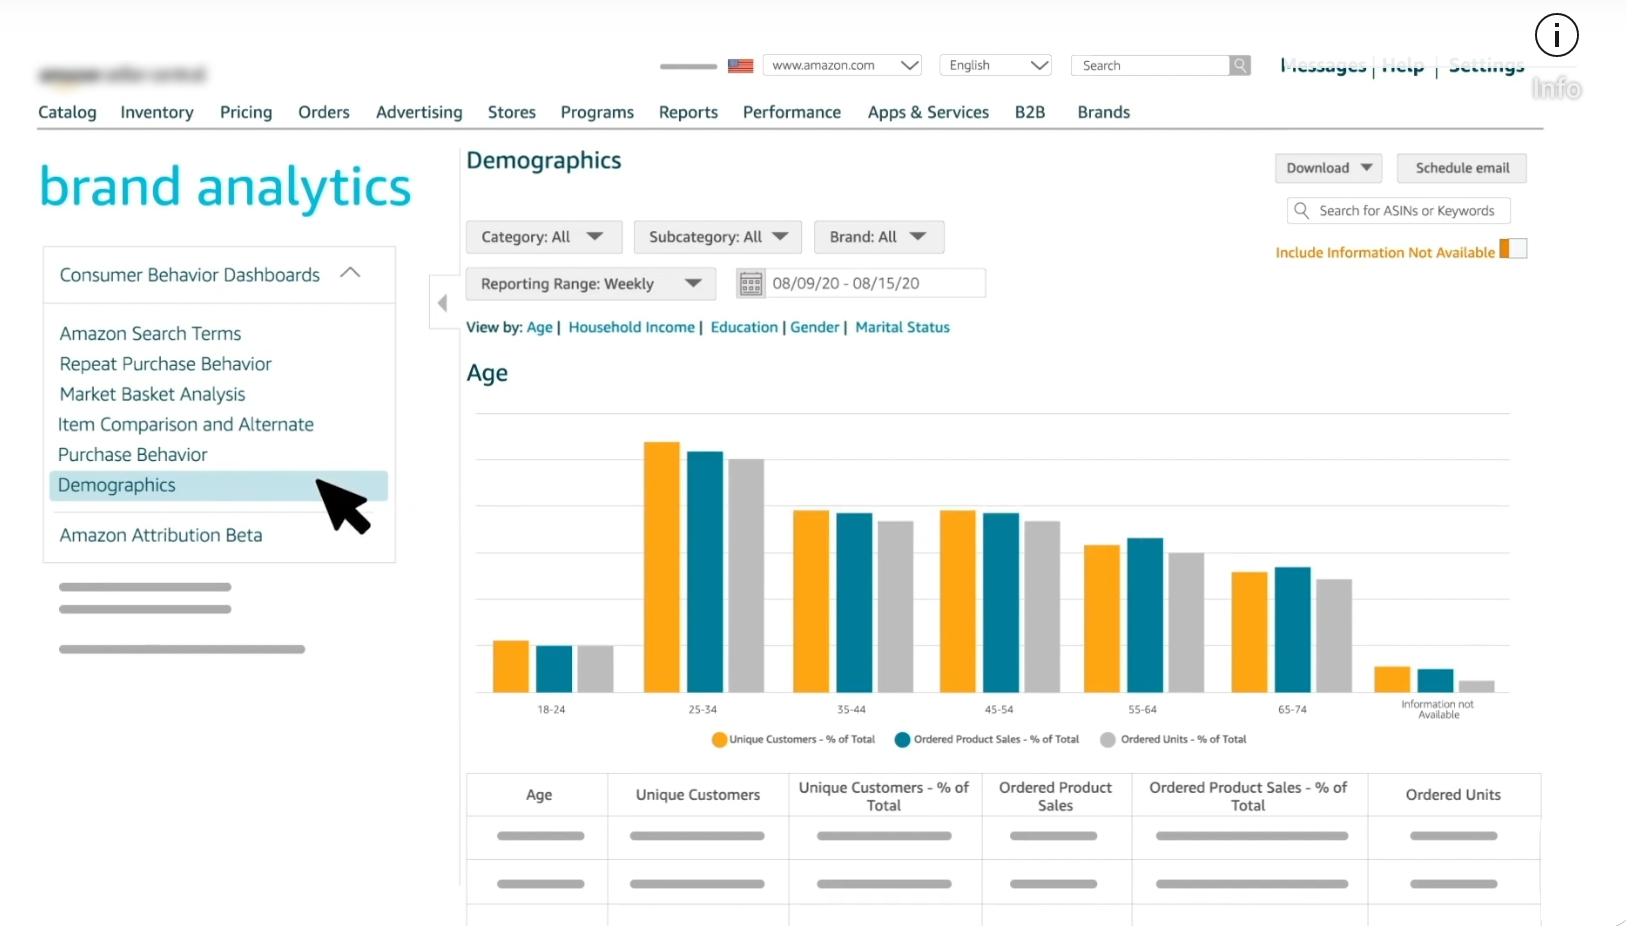
The Demographics Report breaks down buyers by age, gender, household income, and education level, giving sellers a data-backed picture of who is actually purchasing their products.
For instance, if data shows the main customer base consists of women aged 25 to 34, sellers can build targeted ad campaigns on platforms popular with that group and create bundles more likely to appeal to them.
Beyond demographics, the Market Basket Analysis dashboard reveals which products customers most frequently purchase together in a single transaction. For example, when customers are buying baby bottles from a brand, they also frequently purchase baby bottle brushes from other sellers, which signals an opportunity to bundle both items and increase average order value.
Purchase Pattern Analysis
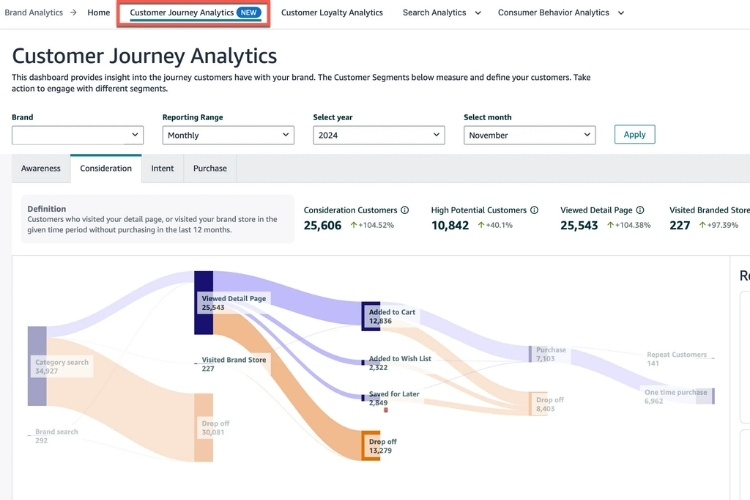
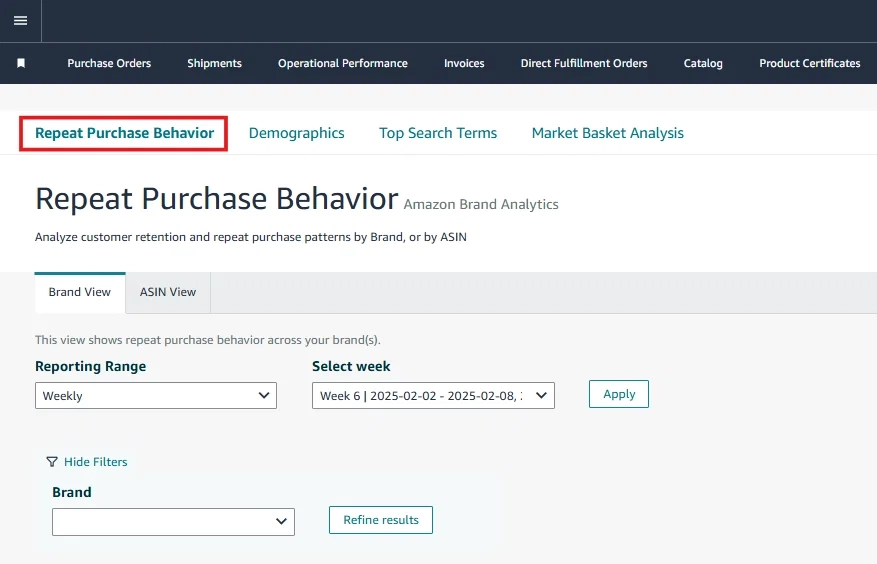
The Repeat Purchase Behavior Report tracks the total number of repeat customers, the share of orders coming from repeat buyers, and the revenue generated specifically from those repeat purchases. Sellers can filter this data by brand or individual ASIN to pinpoint exactly which products drive the strongest customer loyalty:
- Repeat Customers % of Total: The proportion of buyers who returned to purchase again within a selected timeframe.
- Repeat Purchase Revenue: Total sales generated from repeat orders, shown as both a percentage and a monetary value.
- Change vs. Prior Period: Tracks whether retention is improving or declining over time.
For example, if the report shows that customers are repurchasing a skincare product every 30 days, sellers can use that insight to launch a Subscribe & Save subscription, automatically delivering the product monthly to lock in recurring revenue.
Search Term & Keyword Reports
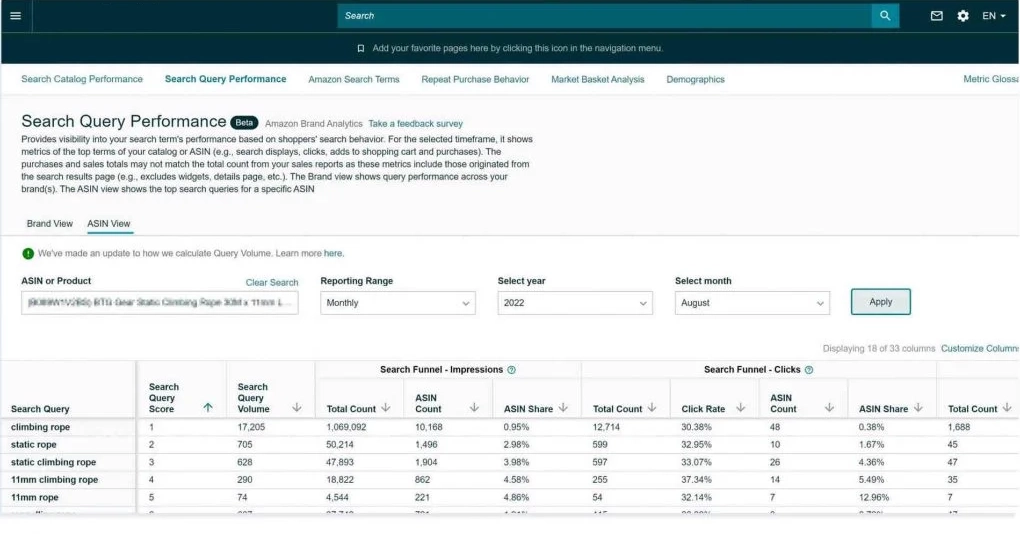
Every time a shopper types something into Amazon’s search bar, that data flows into the Search Query Performance Dashboard, giving sellers a breakdown of search volume, impressions, clicks, cart adds, and purchases for each keyword.
Both brand-level and ASIN-level views are available, so sellers can pinpoint exactly where buyers are dropping off before completing a purchase.
In practice, if sellers manage a wireless earbuds listing might discover that “Bluetooth headphones noise cancelling” drives fewer impressions but converts at a much lower ACOS than broader terms, making it a strong candidate to add into product bullets and target with an exact-match campaign.
Product Performance Metrics
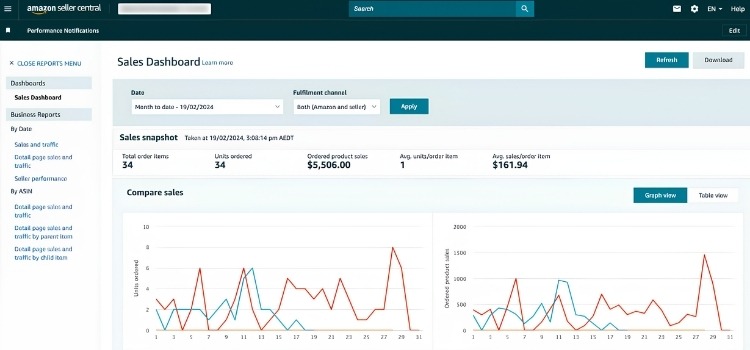
The Detail Page Sales and Traffic report gives sellers a full breakdown of how each product is performing, covering the following key metrics:
- Sessions & Page Views: the number of unique visitors and total views a listing receives within a selected period
- Unit Session Percentage: Amazon’s term for conversion rate, with a healthy benchmark sitting between 7% and 15%; anything below signals a need to revisit listing quality, pricing, or images
- Buy Box Percentage: the share of page views where the seller owns the Buy Box, which directly impacts how often shoppers can complete a purchase
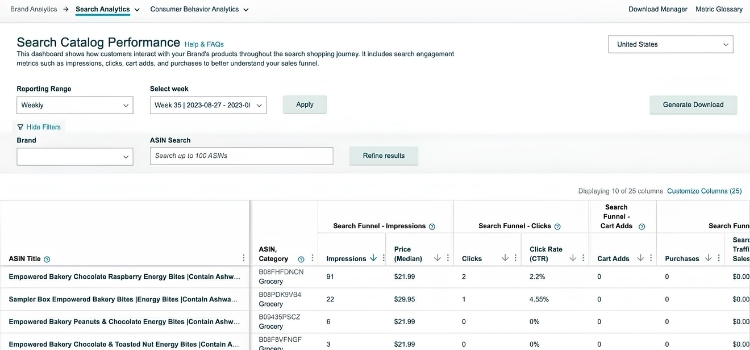
Beyond individual product data, the Search Catalog Performance Dashboard maps how each ASIN performs across the full shopping journey, from search impressions through to cart adds and completed purchases, making it easy to pinpoint exactly where buyers are dropping off.
How Amazon Seller Insights Works?
Amazon Brand Analytics works by aggregating customer search and purchase data from across the marketplace into a series of dashboards inside Seller Central, covering metrics like impressions, clicks, conversions, and customer demographics. Data is typically available within 72 hours of the close of a given reporting period, so sellers are working with recent rather than real-time information.
Once the data is processed, it flows into dedicated dashboards that sellers can access by navigating to Brands → Brand Analytics in Seller Central. Each dashboard serves a specific purpose:
- Search Analytics (Search Query Performance, Search Catalog Performance): Shows how customers find products through organic and paid search
- Customer Behavior Analytics (Market Basket Analysis, Repeat Purchase Behavior, Demographics): Reveals who is buying, how often, and what they purchase alongside your products
- Customer Loyalty Analytics: Segments the audience to help sellers track and increase customer lifetime value over time
All reports can be downloaded as CSV files for offline analysis, and sellers can also connect Amazon Attribution to measure how external marketing channels like Facebook ads or website traffic contribute to Amazon sales.
How To Access And Navigate The Amazon Seller Insights Dashboard?
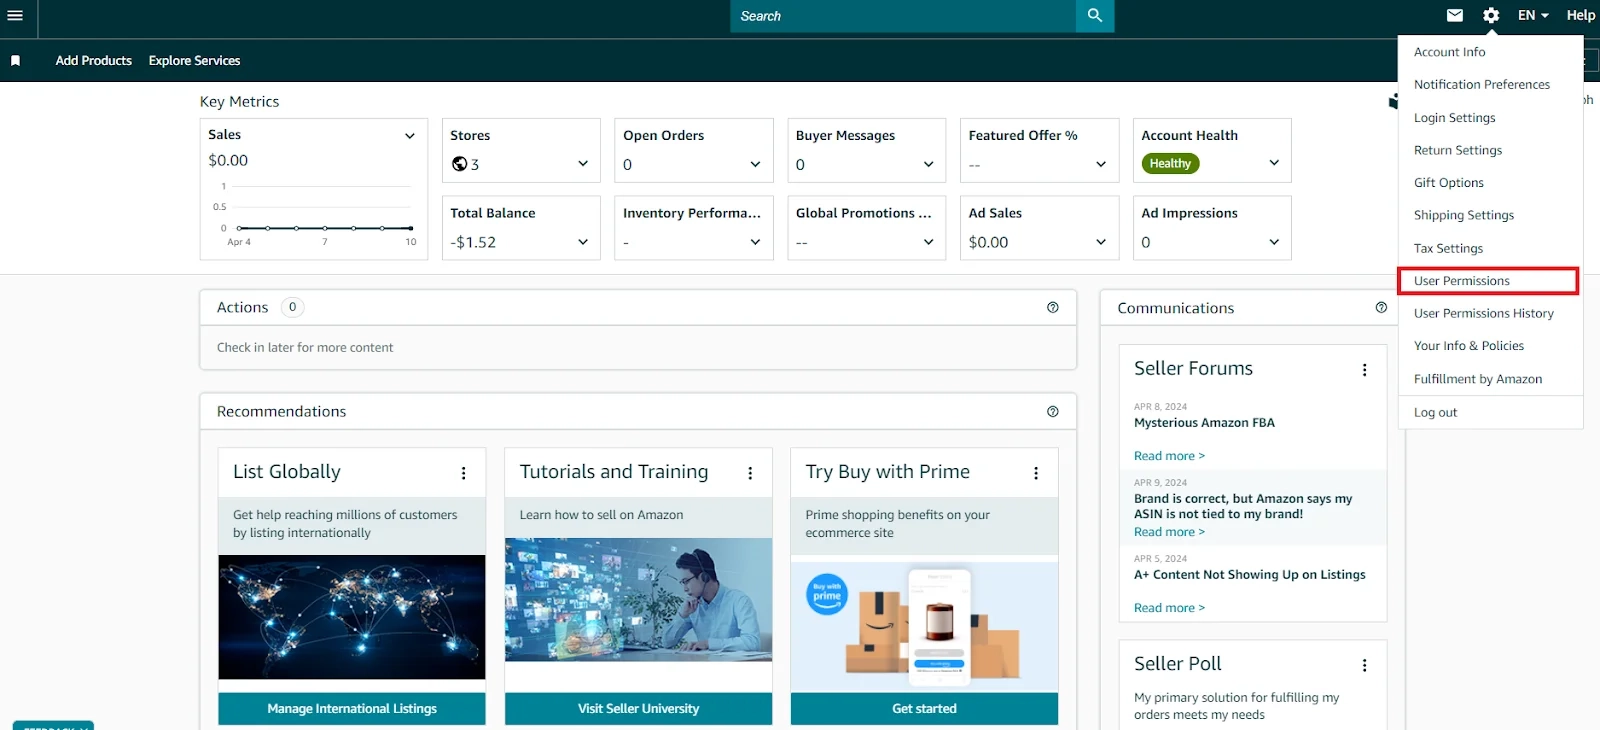
To get started, log in to Seller Central at sellercentral.amazon.com using your registered email and password. From there, the seller follows these steps to reach the key analytics tools:
- Track Sales Performance: Click on Reports in the top menu bar, then select Business Reports to view detailed sales, traffic, and conversion metrics for your entire catalog.
- Access Brand Analytics: If your brand is enrolled in Brand Registry, navigate to Brands → Brand Analytics to access search term data, customer demographics, and purchasing behavior reports.
- Access Returns Insights: Head to the Returns section and select Returns & Recovery: Insights and Opportunities to analyze product return patterns and identify areas for improvement.
Once inside Seller Central, the following sections are most relevant to Amazon Seller Insights:
- Sales Summary: Located on the homepage, it provides a snapshot of sales performance by day, week, or month, with an option to view a full breakdown via “View more of your sales statistics”.
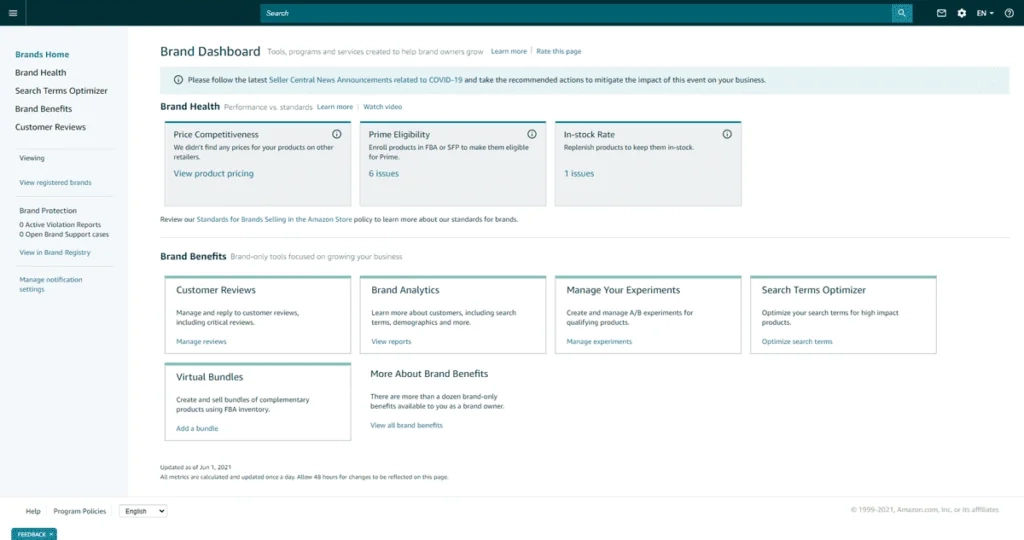
- Brand Analytics Dashboard: Accessible under Brands → Brand Analytics, this is the core of Amazon Seller Insights, housing reports on search queries, demographics, market basket analysis, and repeat purchase behavior.
- Account Health Dashboard: Found under the Performance tab, it monitors critical metrics like Order Defect Rate (ODR), late shipments, and customer service performance.
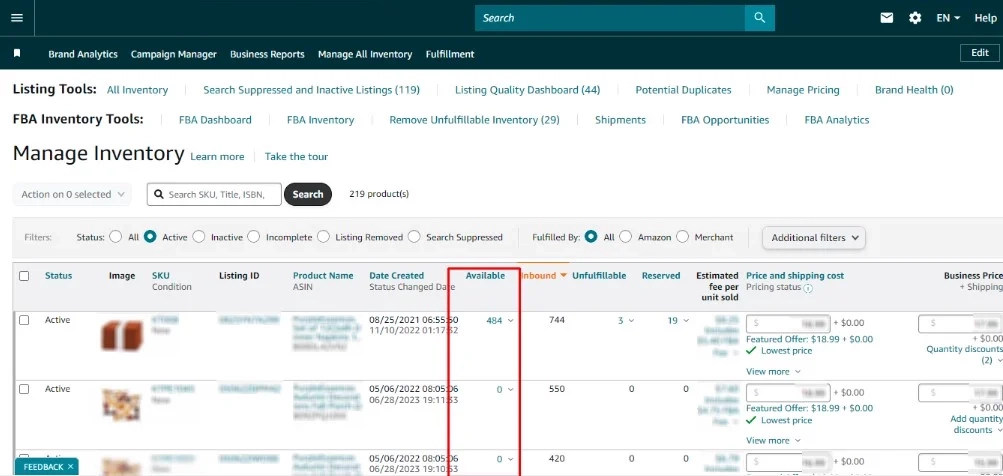
- Inventory Dashboard: Under the Inventory tab, sellers can manage stock levels and check their Inventory Performance Index (IPI) score to avoid stockouts or excess inventory.
How To Use Amazon Seller Insights To Grow Your Business?
Having access to the data is only half the equation, and the real value of Amazon Seller Insights comes from knowing how to apply it across the key areas of your business.
Optimizing Product Listings Based On Insights
Amazon Seller Insights pinpoints exactly which part of a listing needs fixing by mapping drop-off points across the full search funnel. The data from the Search Catalog Performance and Search Query Performance dashboards translates into three specific listing improvements:
- Low impressions: A strong title needs both short-tail and long-tail terms, for example, “yoga mat” for broad visibility and “extra thick yoga mat for bad knees” to pull in high-intent buyers who are closer to purchasing.
- High impressions, low CTR:. A CTR below 0.3% is a warning sign. Fix by rewriting the title for scannability, e.g. “Bluetooth Speaker Wireless Waterproof Portable Mini” → “Waterproof Mini Bluetooth Speaker – Portable, Wireless Sound”.
- High clicks but low conversion: The platform-wide average conversion rate sits between 9% and 11%, so anything consistently below that range signals a need to revisit product copy, images, pricing, or review count.
Building Data-Driven Marketing Campaigns
Seller Insights gives marketers two core inputs for campaign building: who the buyer is and what they search for. Used together, these two data points remove much of the guesswork from ad targeting and budget allocation.
On the audience side, if the Demographics Report shows that 60% of buyers are females under 35 but current ad spend is split evenly across genders, reallocating the Sponsored Ads budget toward that core segment can drive conversion increases of up to 30%.
On the keyword side, targeting the right search terms through the Search Query Performance dashboard has helped sellers achieve quarterly sales jumps of over 40%, simply by aligning ad campaigns with the terms customers actually use.
The Market Basket Report adds another layer by revealing which products are frequently bought alongside yours, making it straightforward to build Sponsored Products campaigns around those complementary ASINs and boost visibility in the “Customers who bought this also bought” section.
Improving Inventory Planning And Supply Chain
Connecting Repeat Purchase Behavior data and Sales Dashboard metrics directly to restocking decisions helps sellers reduce both stockouts and excess inventory through three specific actions:
- Use repeat purchase frequency to set reorder timing. If the Repeat Purchase Behavior Report shows customers rebuying a supplement every 30 days, that cadence becomes the baseline for calculating reorder points and supplier lead times, so stock arrives before demand peaks rather than after.
- Use sales velocity data to avoid the two most costly mistakes. Running out of stock hurts search rankings and loses sales, while holding more than 90 days of excess supply triggers Amazon’s long-term storage fees and risks account-level storage restrictions.
- Plan supplier communication around the data, not guesswork. If sales data from previous years shows a consistent seasonal spike, sellers should communicate expected volumes to suppliers early enough that manufacturing and shipping can be scheduled in advance, rather than placing urgent orders that risk delays.
Amazon also provides a native demand forecasting tool accessible via the Restock Inventory page in Seller Central, which predicts weekly demand up to 40 weeks ahead by factoring in order history, seasonality, and promotions, giving sellers a concrete starting point for supply chain decisions.
Identifying New Product Opportunities
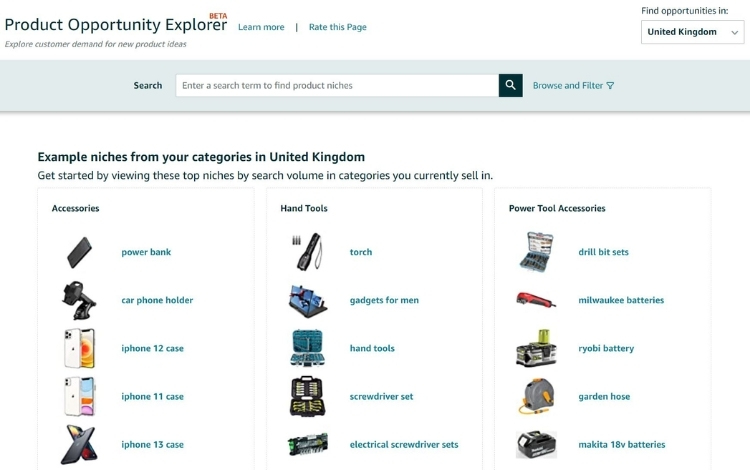
Sellers can use Product Opportunity Explorer (accessible via Growth in Seller Central) to evaluate niches using real Amazon search and purchase data before committing to any inventory investment. A strong opportunity typically shows up when these metric combinations align:
- Search volume is climbing quarter over quarter, but conversion rate remains low relative to that volume, meaning many customers are actively searching for a product that existing listings are failing to satisfy.
- The average out-of-stock rate within the niche is high compared to product count, confirming that current sellers cannot keep up with demand, and there is room for a new entrant to capture consistent sales.
- The percentage of Prime-eligible products and the percentage of products running Sponsored Products ads are both low relative to search volume, signaling that the niche attracts meaningful traffic but competitors are not investing heavily to defend it.
Once a niche passes those filters, the Customer Review Insights tab helps refine the product angle. For example, if negative reviews in a yoga mat niche consistently cite smell as a pain point while grip receives mixed sentiment, smell becomes the higher-priority problem to solve in product development since it has a more direct negative impact on star ratings.
Frequently Asked Questions About Using Amazon Seller Insights
Yes, Amazon Brand Analytics is completely free for sellers enrolled in Amazon Brand Registry with a Professional selling plan, with no signup fee or monthly maintenance cost.
Amazon Seller Insights provides aggregated customer search and purchase data, covering metrics like impressions, clicks, conversions, market basket items, and customer demographics across multiple dashboards inside Seller Central.
Data is generally available within 72 hours of the close of a given reporting period. Most dashboards can be filtered by week, month, or quarter, depending on the reporting range selected.
Get Professional Help from Megaficus
Amazon Seller Insights puts powerful data directly in your hands, but knowing which metrics to act on and how to translate them into listing improvements, ad campaigns, and inventory decisions is where most sellers get stuck. Building a consistent process around these tools takes time, and the margin for error on a competitive marketplace like Amazon is slim.
If you want expert guidance on turning your seller data into measurable sales growth, the team at Megaficus is ready to help.