Most Amazon sellers rely on bestseller rankings and competitor reviews for research, but that only provides a snapshot. Amazon Category Insights goes further by surfacing first-party data on demand, competition, and buyer preferences directly from the marketplace. In this guide, Megaficus breaks down how to use it effectively.
Quick Summary
- Amazon Category Insights is a free, first-party tool inside Seller Central that gives sellers structured data across key category metrics
- How to access: Navigate to Growth, select Marketplace Product Guidance, then click the Category Insights tab
- Demand analysis: Units sold, glance views, search volume, and Search to Purchase Ratio reveal where real buying activity is happening
- Competition level: Sponsored ad penetration, average seller age, and market saturation metrics show how hard a category is to enter
- Trend spotting: Timeframe filters, product count movement, and the Features section surface shifts before they peak
- Decision making: Cross-referencing multiple signals together turns raw data into a concrete launch decision
- Category Insights vs third-party tools: Free and data-accurate for niche validation, while Helium 10 and Jungle Scout are better suited for day-to-day operations.
What Is Amazon Category Insights?
Amazon Category Insights is a reporting feature inside Amazon Seller Central that gives sellers structured data across key metrics such as glance views, units sold, revenue, buyer preferences, competition levels, and return rates. All data is sourced directly from Amazon Marketplace Product Guidance, making it reliable and specific to actual marketplace activity.
The feature is open to all seller types, including those without brand registry, and supports performance benchmarking within a category.
To access it, sellers need an active professional selling account in one of the four supported marketplaces: the US, UK, Japan, and Germany. Sellers on the free plan can access the top category by default, while any paid plan unlocks unlimited category access.
How to Access Amazon Category Insights in Seller Central?
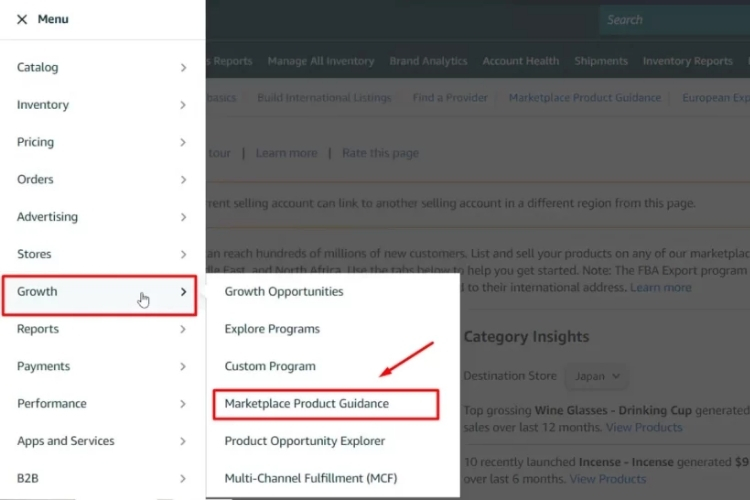
To access Amazon Category Insights, sellers need to navigate through the Growth section in Seller Central. The path is straightforward and takes less than a minute to reach.
- Log in to your Amazon Seller Central account.
- Hover over the Growth menu at the top navigation bar.
- Select Marketplace Product Guidance from the dropdown.
- Click the Category Insights tab within the dashboard.
Once inside, the default view displays data for all ASINs within a selected category. Sellers can narrow this down by choosing a broad category, such as Home & Kitchen or Electronics, then filtering further by product type and item type keyword to reach the most specific subcategory level.
From there, switching between the All ASINs, Top Grossing, and Newly Launched views gives a different angle on how the category is performing, making it easier to benchmark against the right set of competitors from the start.
What Amazon Category Insights Reveals About Your Market
Category Insights pulls data directly from Amazon’s marketplace, giving sellers a clear read on demand, competition, and trends across any category.
Demand Analysis: Identifying When and Where Demand Is Moving
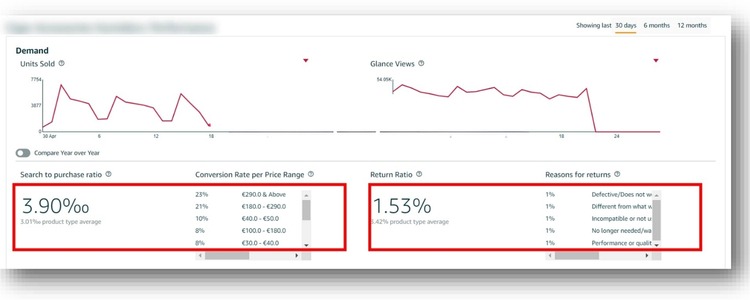
Amazon Category Insights surfaces demand data through four core metrics: units sold, net sales, glance views, and search volume. Together, these numbers tell you not just how much a category is selling, but whether customer interest is actually converting into purchases.
The most telling signal is the Search to Purchase Ratio. When search volume is high, but purchase rate is low, it typically means demand exists, but current products are failing to satisfy it. Add below-average star ratings into that picture, and you have a clear gap in the market worth exploring.
To read demand effectively, focus on these data points in combination:
- Units sold + net sales: size of actual buying activity in the category
- Glance views: how often shoppers land on product pages, reflects interest level
- Search to Purchase Ratio: whether that interest converts to sales
- Return Ratio: High returns often signal unmet expectations, which is a demand signal in disguise
All demand metrics can be viewed across three timeframes: the last 30 days, 6 months, and 12 months. Sellers can also toggle on the Compare Year over Year option to overlay the previous 12 months directly onto the current graph, making it easier to distinguish genuine growth from seasonal patterns that repeat annually.
For the most targeted read on demand, narrow your selection down to an item type keyword, which is the most specific subcategory level available.
For instance, instead of analyzing “Home & Kitchen” broadly, drilling down to something like “shower curtain liner” gives you metrics tied to actual buyer behavior in that exact niche, making the data far more relevant for a product launch decision.
Competition Level: Understanding Who You Are Up Against
Understanding competition in a category goes beyond counting how many sellers are present. Category Insights breaks it down through several measurable signals that together paint a clearer picture of how hard a market is to enter.
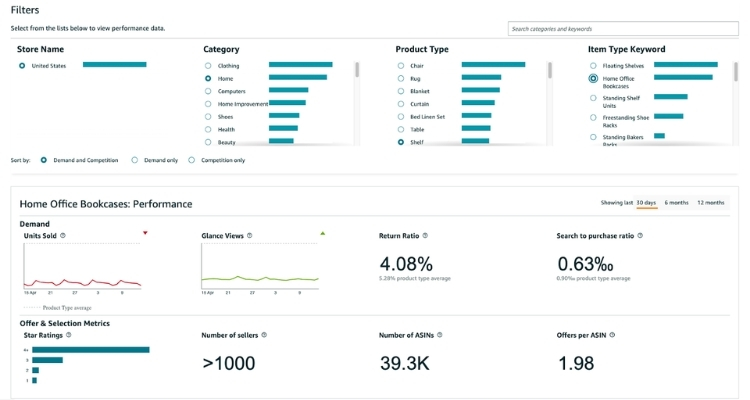
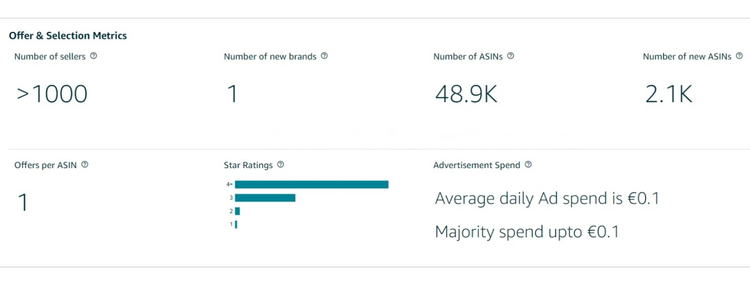
The Offer & Selection Metrics section is the starting point for reading competition. It shows market saturation levels and customer satisfaction data, helping sellers assess whether a category still has room for new entrants or is already locked up by established players.
Three metrics worth paying close attention to:
- Percentage of products using sponsored ads: The higher this number, the harder it is to gain organic visibility. When most sellers in a category are running ads, ranking without paid traffic becomes significantly more difficult, and advertising costs rise.
- Average selling partner age: This reflects how experienced the existing sellers in a category are. A high average age means new sellers will be competing against operators who have spent years optimizing their listings, pricing, and supply chains.
- Avg. Number of Sellers Per Product: Higher numbers indicate more competition for the same item, but also confirm that demand is strong enough to sustain multiple sellers.
- Number of new brands and new ASINs: A high count of new brands entering a category signals growing interest from sellers, while a rising number of new ASINs indicates the market is still attracting fresh competition rather than being locked up by existing players.
Category Insights also offers three views to benchmark competition: All ASINs for a full market overview, Top Grossing for the top 10 ASINs by revenue, and Newly Launched for the top 10 ASINs introduced in the last six months.
For example, if you pull up a category like shower curtains and see the sponsored ad percentage sitting at 90-98%, search conversion low, and average selling partner age close to 10 years, those three signals together indicate a market where established sellers dominate both paid and organic results. Entering that category without a clear differentiation angle would mean competing at a significant disadvantage from day one.
Trend Spotting: Acting on Shifts Before They Peak
Spotting trends early inside Category Insights comes down to reading two types of signals: demand movement over time and shifts in what customers actually want from a product.
The timeframe filter on all graphs is the first place to start. Adjusting it across different periods reveals whether a category is growing, plateauing, or declining. If you open a category and notice search volume climbing steadily over 6 months while units sold follow the same upward curve, that pattern suggests genuine demand growth rather than a one-time spike.
Product count movement is another signal worth tracking. If you observe the number of active products in a niche dropping from 90 to 65 between September and December, it can mean stronger listings are consolidating market share, which tells you the window for new entrants is narrowing and timing matters.
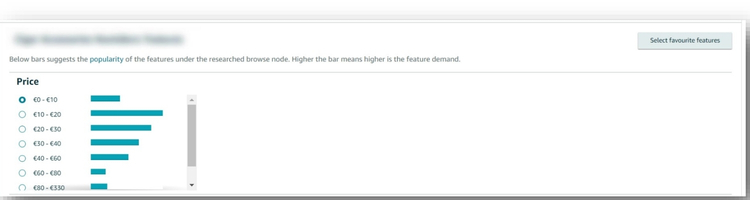
The Features section adds a different dimension to trend spotting by showing which product characteristics are gaining traction with buyers:
- Price, material, size, and color each have a performance bar reflecting current customer preference
- Selecting combinations of high-performing features and saving them via the Favorite Features button builds a running record of what the market is gravitating toward
- Downloading that list over time lets you track how feature preferences shift across different periods
If you check a category and find that a specific material or size is consistently outperforming others across multiple timeframe snapshots, that is an early signal worth factoring into product development before competitors catch up.
How To Turn Category Insights Data Into A Business Decision?
Most sellers collect data from Category Insights but stop short of connecting it to a concrete decision. The data only becomes useful when multiple signals are read together rather than in isolation.
A practical starting point is the combination of search volume, Search to Purchase Ratio, and star ratings. High search volume paired with a low purchase rate and below-average ratings tells you demand exists, but current products are not satisfying buyers, which is where a well-differentiated product has room to enter.
From there, you should layer in competition signals to evaluate the category more thoroughly before committing to a launch decision:
- Sponsored ad penetration above 90% and a high average seller age mean strong differentiation, and a realistic ad budget is required from day one
- Newly launched ASINs performing well signals the category is still accessible and timing works in your favor
- Product count declining while search conversion is rising indicates the window for new entrants is narrowing
If you are considering launching a silicone kitchen spatula and the data shows high search volume, a Search to Purchase Ratio below average, and top reviews consistently mentioning heat resistance as a complaint, the decision becomes clear: enter the category with a heat-resistant variant, lead with that feature in your listing, and price within the range the Features section identifies as the sweet spot.
Amazon Category Insights vs Other Amazon Research Tools
Amazon Category Insights stands out from other research tools primarily because its data comes directly from Amazon, eliminating the estimation errors that third-party tools rely on. For Professional sellers, it is also completely free, making it the most accessible option for validating a niche before committing to a launch.
Here is how it compares to the most commonly used alternatives:
| Tool | Data Source | Cost | Best For |
|---|---|---|---|
| Amazon Category Insights | Direct from Amazon | Free | Niche validation, demand, and return analysis |
| Helium 10 | Estimated + Amazon data | Paid | Keyword research, PPC management, reverse ASIN |
| Jungle Scout | Estimated | Paid | Sales estimates, product tracking, beginner research |
| SmartScout | Estimated + Amazon data | Paid | Brand mapping, wholesale, competitor analysis |
| Keepa | Direct from Amazon | Freemium | Historical price and BSR tracking |
One feature that sets Category Insights apart from all of the above is the Returns tab, which shows the primary reasons customers return products within a niche. No third-party tool replicates this directly, as it pulls from Amazon’s internal return data.
The practical verdict is straightforward: use Category Insights to validate whether a niche is worth entering, then use Helium 10 or Jungle Scout to manage the day-to-day operations, keyword strategy, and competitive tracking once you are inside that category.
FAQs About Amazon Category Insights
All seller types can access it, including those without brand registry. Navigate to Growth, select Marketplace Product Guidance, then click the Category Insights tab. Currently available in the US, UK, Japan, and Germany.
Category Insights covers category-level data like units sold, glance views, and return reasons. Product Opportunity Explorer goes deeper into the niche and ASIN level with search terms, purchase drivers, and competitive metrics.
Sellers cross-reference search volume, Search to Purchase Ratio, and the Features section to spot demand gaps, then check competition metrics like sponsored ad penetration and average seller age to decide whether the category is worth entering.
Get Professional Help from Megaficus
Amazon Category Insights gives you a direct line to what the market is actually doing, not what you assume it is doing. Used consistently, it replaces guesswork with data across every stage of a product decision, from identifying demand gaps to timing a launch and benchmarking against the competition. The sellers who act on these signals early are the ones who enter categories before they peak rather than after.
If you need expert guidance to build a stronger Amazon strategy around data like this, the team at Megaficus is ready to help.